The Gateway report shows the usage trends of the NetScaler Gateways in your organization by summarizing data about past activity and performance. You can view the data either individually for each gateway, or in summary form, for all selected gateways. By default, the selected time frame is the previous 24 hours.
Use the report to answer questions such as:
- How many user connections does a certain gateway usually handle during business hours?
- When did the selected gateways experience the highest traffic rate?
- How does the response rate compare to a request rate for a certain gateway?
Report Functionality
The report provides the following functionalities:
- You can click a data point in the charts to view the minimum, average, and maximum number of user connections, request/response bits, and request/response rates during the selected time period.
- You can click a data series name on the bottom of the chart to highlight or toggle the series on the charts.
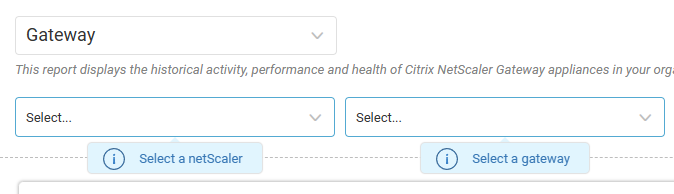
Select Which Gateways to View
By default, the report shows all gateways in your environment.
To select which gateways to include in the report:
- In the first dropdown, select which NetScalers to include.
- In the second dropdown, select which gateways to include. The list of available gateways depends on your selected NetScalers.
Select a Graph Display Mode
Set whether to plot gateways on the graphs individually, or as a summary of all selected gateways.
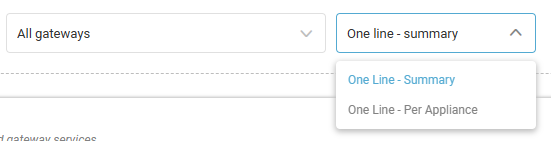
- One Line - Summary. By default, plots all selected gateways as a single line. If the metric is a percentage, the value is the average of the percentages of all selected gateways. For all other metrics, the value is the sum of the average values of all selected gateways.
- One Line - Per Appliance. Plots all selected gateways individually.
The graph display mode does not affect the grid at the bottom of the report.
The report displays the following charts:
- Concurrent Users. Total (average) number of user connections to all (each) of the selected gateway services together (individually).
- Traffic In/Out. Total (average) rate of request/response bits, for all (each) of the selected gateways together (individually), in Mbps.
- Request/Response Rate. Total (average) rate of requests/responses, for all (each) of the selected gateways together (individually).
Column Descriptions
The Gateway report contains the following columns. You can click a Gateway name to display the details of the selected appliance in the grid.
| Column | Description |
| NetScaler Name | Name of the NetScaler. |
Gateway Name | Name of the Gateway. Click the name to open another NetScaler Gateway report with only this Gateway selected. |
IP Address | IP address on which the service is running. |
Primary Port | Port on which the service is running. |
Traffic In | Average rate of request bits received by the Gateway, in Mbps. |
Traffic Out | Average rate of response bits received by the Gateway, in Mbps. |
Concurrent Users | Average number of concurrent user connections to the Gateway service. |
Request Rate | Average rate of incoming requests to the Gateway. |
Response Rate | Average rate of outgoing responses from the Gateway. |
Certificate Name | Name of the certificate. |
Certificate Expiration Date | Expiration date of the certificate. |