This article covers how to configure an Omnissa Horizon connection and monitor your Horizon components with ControlUp.
Data Collector
We recommend that you always use a dedicated data collector for Omnissa Horizon and all EUC environment connections. A data collector can be any machine that has the ControlUp Agent installed. Do not mix data collector and non-data collector connections in your EUC environment, as they might return unexpected results.
To check if a specific machine is already configured as a data collector, see here.
To learn how to define a data collector for Horizon, watch our video.
To add an Omnissa Horizon connection using PowerShell cmdlets, see here.
Omnissa REST APIs
To streamline the data collection process, we migrated the Omnissa Horizon Server from SOAP to REST API in ControlUp Real-Time DX version 9.1.5. Our Horizon data collection module now uses Omnissa’s REST APIs instead of the SOAP-based View API. We integrated load balancing and throttling to ensure faster performance and data integrity, enabling you to more effectively troubleshoot issues and maintain your Horizon environment.
Requires Omnissa version 2406 or higher
Note that ControlUp only supports the REST API for Omnissa Horizon version 2406 or higher.
The migration to REST APIs provides significant performance improvements, better reliability, and ensures compatibility with future Omnissa versions where SOAP APIs will be deprecated.
Key Benefits of REST APIs
Up to 70% faster data collection in large environments reduces collection time.
All data endpoints are queried simultaneously instead of sequentially.
Lightweight JSON payloads reduce network overhead compared to XML/SOAP.
Modern HTTP/2 support enables better connection management and multiplexing.
Bearer token with OAuth authentication.
TLS 1.2 enforcement to improve encryption standards.
Certificate validation with optional bypass for testing environments.
If you want to revert your environment from REST API back to SOAP, configure the registry settings below.
Prerequisites
Component Requirements
Full support for Omnissa Horizon v7.4 and higher
Limited support for Omnissa Horizon v7.0 - v7.3
Network Requirements
Enable TCP port 443 (HTTPS) from all Real-Time Consoles machines, Monitor machines, and Data Collector machines to Horizon Connection Server.
Service Account Requirements
The Read-Only role is sufficient for all monitoring purposes. If you want to perform built-in Horizon actions, then the service account needs the following permissions:
Enable Farm and Desktop Pools
Manage Machine
Manage Sessions
Manage Global Sessions (Cloud Pod architecture only)
Add your credentials to your shared credentials before you add the Horizon integration.
Add a Horizon Connection to ControlUp
Functionalities available only in version 9.2.5
The following section describes components and functionalities only available in ControlUp Real-Time DX version 9.2.5.
To add a Horizon connection in your ControlUp environment, perform the following steps:
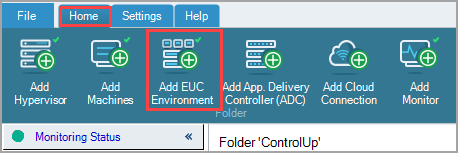
In the Real-Time DX Console, go to Home > Add EUC Environment to open the Add EUC Environment Connection window.
Set the Solution / Platform to VMware Horizon.
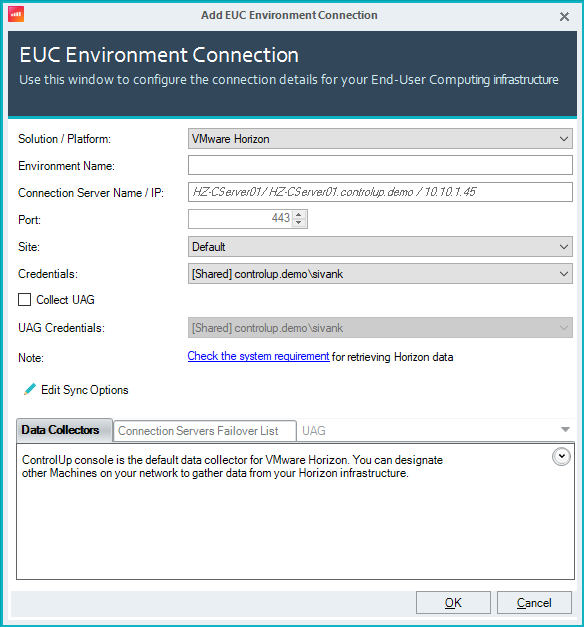
Optionally, enter the Environment Name.
Optionally, change the default Connection Server Name / IP.
Optionally, select the Site to assign the connection to.
Select Credentials for your Horizon environment from your shared credentials. The required permissions for the credentials are described above. You should have added these credentials as shared credentials in your Monitor settings.
Optionally, from version 9.2.5 only: select the Collect UAG checkbox to collect metrics from UAG appliances. Select UAG Credentials for your UAG servers from your shared credentials.
For versions lower than 9.1 only: configure your Pod Connection Settings. If you want to remove a pod connection, select it from the dropdown and clear the option Add this Pod to ControlUp Console.
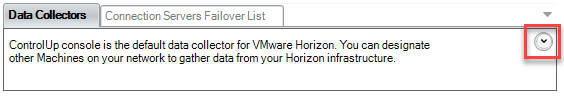
Expand the Data Collectors tab to configure a data collector for the Horizon connection:
Select the default data collector and click Remove.
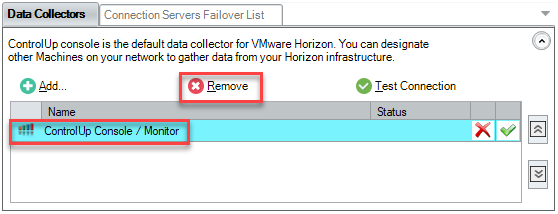
Click Add and select the machine that you want to use as a data collector.
Optionally, add another machine to use as a backup data collector in case the primary data collector is down. Note that the first machine in the list is the primary data collector.
Optionally, expand the UAG tab to configure UAG servers as data collectors for the Horizon connection:
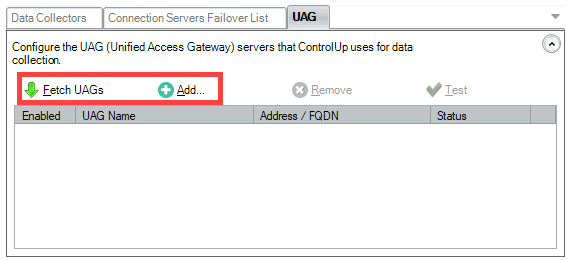
Click Fetch UAGs or Add and select the UAG server that you want to use as a data collector.
Optionally, select the Enable UAG checkbox.
Click OK.
Click OK to save the Horizon connection.
After ControlUp connects to your Horizon site, the Connection Servers Failover List tab contains the names of all the connection servers assigned to the site.
Horizon Monitoring
Adding a Horizon connection to ControlUp provides enhanced monitoring, including:
Automatic discovery of Horizon components in both standard and Cloud Pod architecture.
Seamless association of Horizon components with entities from different data sources, such as hypervisors and in-guest agents for complete line-of-sight from infrastructure to process.
Connection server health status and license monitoring.
Enhanced session monitoring with Horizon performance metrics.
Horizon-focused presets for Horizon Pods, connection servers, pools, machines, and sessions views.
Enhanced Horizon environment management capabilities, including new Horizon specific:
Built-in actions
Security policy permissions
Script Actions
Automated Actions
Enhanced Virtual Expert rules and recommendations
To monitor the performance of your VDIs and connection servers, you must install the ControlUp Agent on those machines.
Licensing
Each session discovered by the Horizon connection uses 1 ControlUp license.
Horizon RDSH Monitoring
ControlUp can discover Horizon RDSH components and offer real-time visibility of RDS sessions and applications. RDSH objects in the Horizon integration are displayed on the organizational tree and data grids, with drill down relations for easy troubleshooting and navigation.
The views include real-time metrics displaying the current configuration, availability, aggregation counters, health status, and other metadata on the following objects:
Application Pools
Farms
RDS Hosts
RDS Desktop Pools
RDS Sessions
Revert Omnissa from REST APIs to SOAP
To revert your Omnissa Horizon environment from REST API back to SOAP, configure the following registry settings on each machine with an Omnissa connection:
Registry Key: HKLM\SOFTWARE\Smart-X\ControlUp\Agent\Horizon Data Collection
Value Name: Use Soap
Value Type: REG_WORD
Value Data: 1 (revert to SOAP), 0 (switch back to REST API)
Tip to add registry settings on multiple machines
Use the Controllers pane to configure the registry settings on multiple machines simultaneously.