Alerts allow you to proactively monitor your environment by notifying you or performing automated actions when certain conditions are met.
There are two methods for creating Devices alerts in ControlUp:
- Static Thresholds: Triggered when a metric hits a fixed numerical value (such as CPU > 90%).
- Anomaly Detection: Triggered when ControlUp detects behavior that deviates from a historical baseline. For details, read Anomaly Detection Alerts.
This article describes static threshold alerts.
How Static Threshold Alerts Work
ControlUp's alert system evaluates your environment every minute to determine if your configured threshold has been met. If the metric reached the threshold the required number of times within the lookback duration, the alert triggers.
Configuration Steps
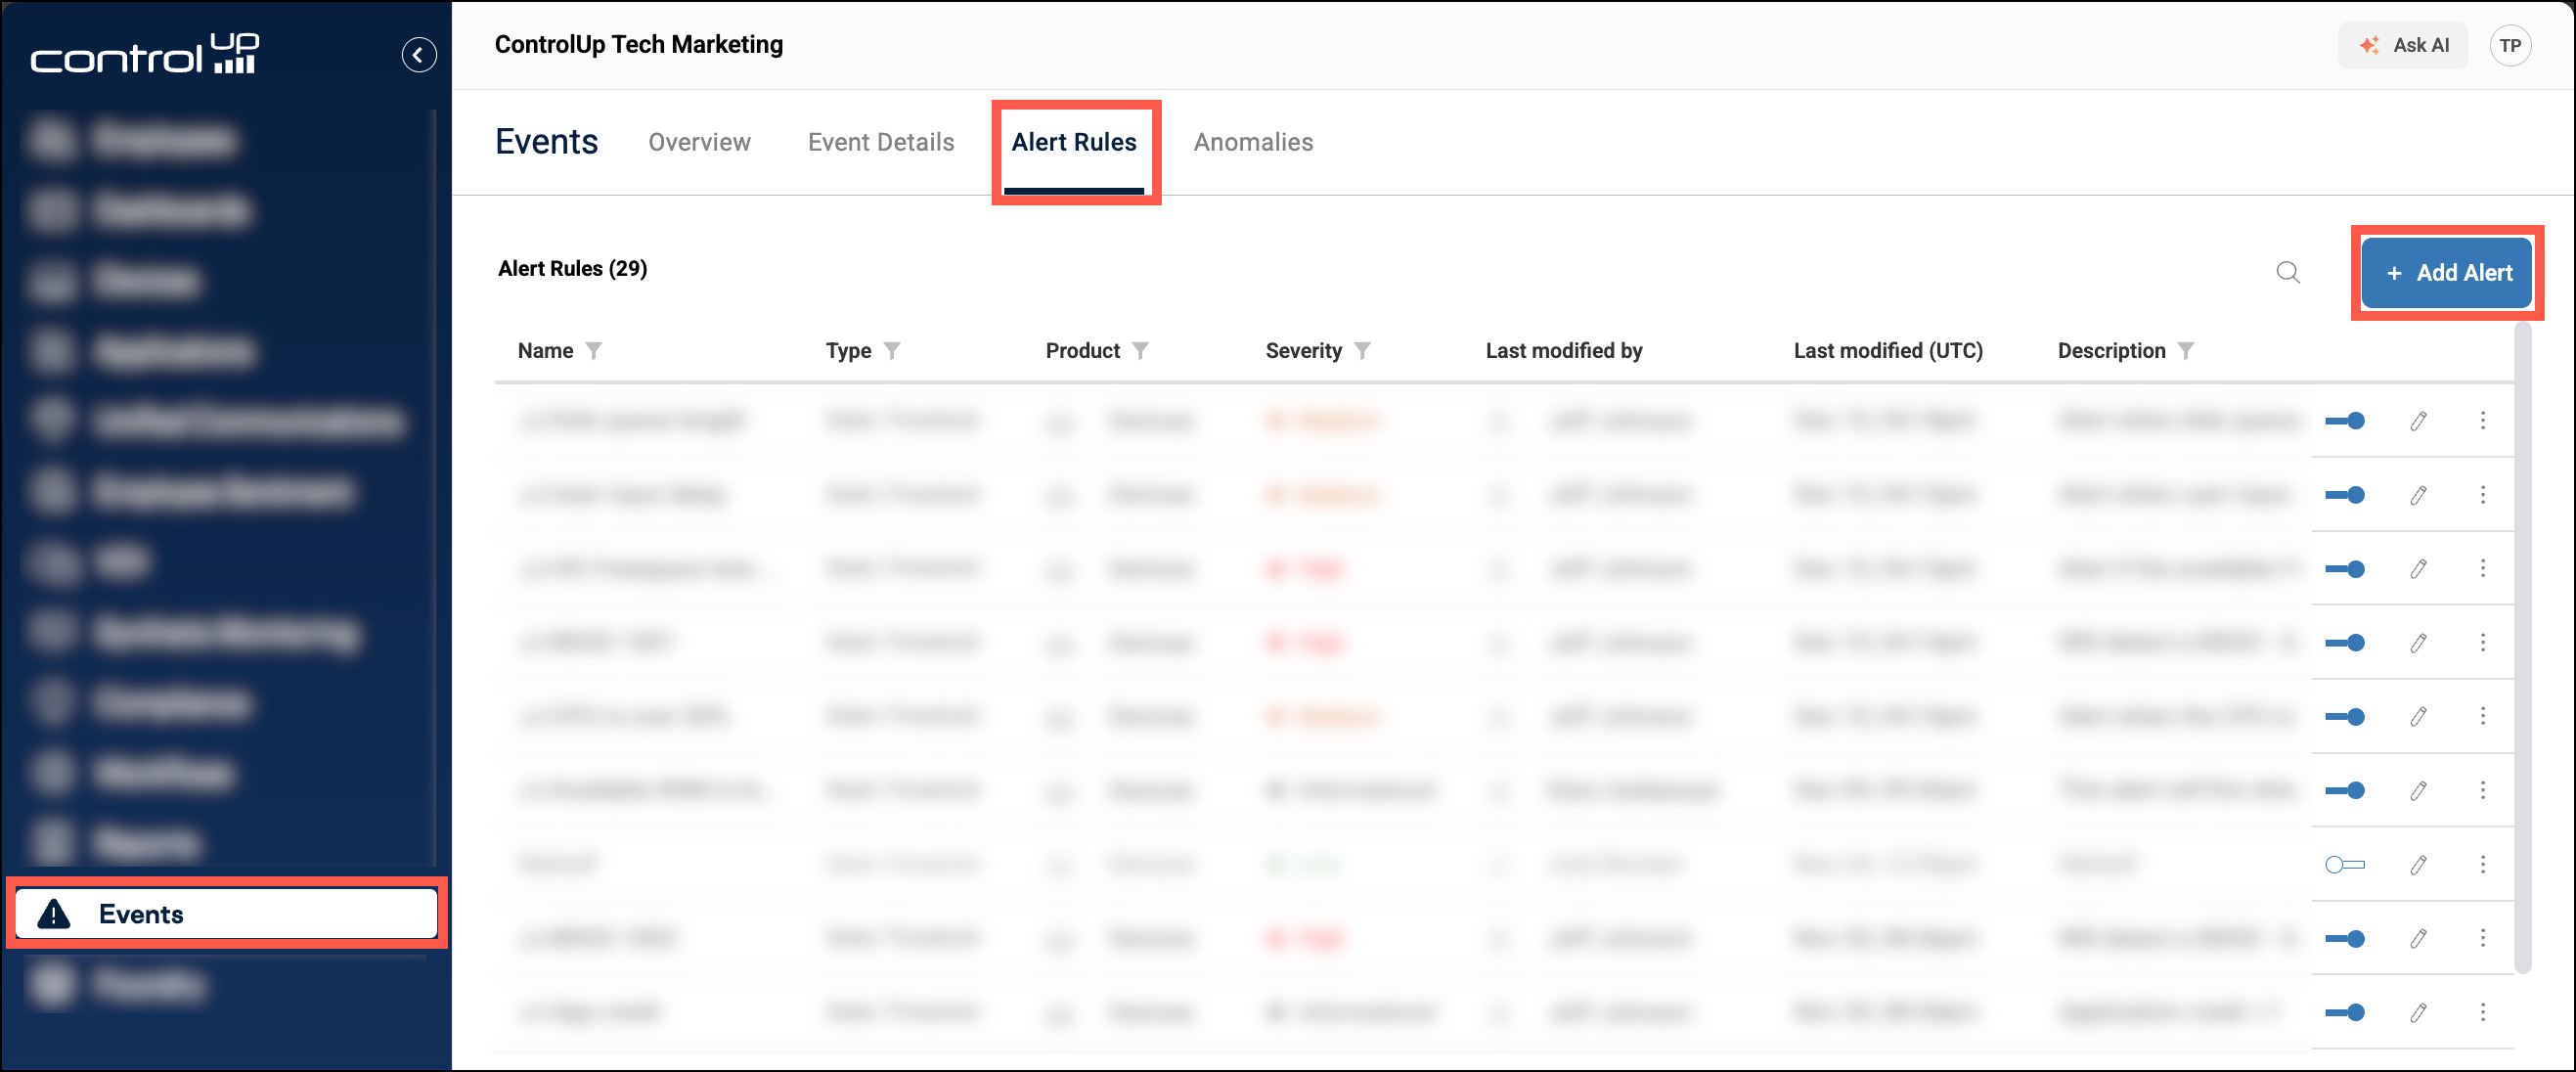
To start creating a new alert, navigate to Events > Alert Rules > Add Alert.
1. General settings
At the top, make sure Product is set to Devices. Give the alert a name and description, and decide whether you want the alert to be enabled or disabled when you save it.
2. Set the alert method
Under Method, select Static Threshold.
3. Set the metric thresholds
- In the Category field, select what type of metrics you want to use for your alert.
- At the top of the dropdown list, there are predefined categories for you to choose from. If you are familiar with ControlUp's data index database, you can scroll down and select a specific data index.
- Choose a Severity level for the alert. This will help you manage your alerts by importance.
- Build your alert conditions by selecting a metric and adding a threshold.
- The available metrics depend on your selected Category. If you selected a predefined category, then the corresponding data index and field is listed in brackets after the metric's name. If you selected a specific data index for the category, make sure you use the correct operator for the metric's data type (string fields must use the 'Contains' operator).
- If you want to add conditions on more metrics, click + Add condition. Note that ALL conditions must be met to trigger the alert (they are ANDed together).
Advanced conditions
If you add a string condition, you can use the following operators:
- Does not contain - For string metrics, select 'Contains' and enter
!!before the condition value to create a 'does not contain' condition. - OR - For string metrics, select 'Contains' and enter
||between two condition values to create an OR condition. - Neither/Nor - For string metrics, select
Containsand combine!!with||to create a 'Neither/Nor' condition. For example.!!Canada||!!Norwayexcludes both Canada and Norway. - Elastic - You can use Elastic in conditions. For example,
last_communication <= now-15mtriggers if a device hasn't been online in 15 minutes.
4. Set the alert timing
Below the conditions, you must choose how many times the conditions must be met within a specific time window to trigger the alert.
We recommend a time window of at least 600 seconds (10 minutes) because some data is collected at 10-minute intervals. Ensure your "hits" count does not exceed the expected data collection frequency within a given time window.
To prevent repeated alerts, set the minimum retrigger delay time (up to 86400 seconds). This sets how long the alert system must wait before retriggering an alert on the same device.
5. Follow-up actions and notifications
Actions
You can automatically send a survey or run scripts on devices that trigger the alert. Before you select a script or survey, you must use the Script platform field to narrow down the options by OS platform. Note that this is a selection filter only, and it does not determine which devices are eligible to trigger the alert.
Surveys are supported only on Windows and macOS devices. Only on-demand surveys are available to select from the dropdown.
To learn more about adding scripts to ControlUp, read the Scripting Guide.
Notifications
Enter a webhook URL or a semi-colon separated list of email addresses to receive a notification when the alert is triggered.
The notifications contain the name of the alert, and which devices triggered it.
ServiceNow integration
ControlUp offers a ServiceNow integration to automatically create, update, and resolve ServiceNow tickets based on Alerts. For details, read ServiceNow Integration
Creating an alert based on a custom data index
To create an alert using a custom data index, the index must contain the following fields:
device_iddevice_typedevice_name
Troubleshooting
If an alert doesn't behave as expected, check the following:
- If a device comes back online after a few hours and uploads its data you might not get an alert because the system takes into account the time that the event happened, NOT the time when it was uploaded to the server.
- Check Configuration > Data to confirm that the the event you think you should have received an alert about was recorded in the database, and that its recorded _created_local time occurred within the configured Time Window.
- Check if the Retrigger Delay is set too high. The Retrigger Delay parameter prevents you from being flooded with alerts every 60 seconds, but if it is configured to a value which is too high, you might not receive alerts for an excessively long period of time.
Alert scaling and volume limits
If an alert's conditions are met by 50 or more devices simultaneously, the system prioritizes platform stability by suppressing individual follow-up actions.
In this scenario:
- Scripts, surveys, webhooks, and email notifications will not be executed or sent.
- An entry will be created in the System Events log indicating that the alert triggered on too many devices.
If you frequently hit this limit, refine your alert conditions (such as narrowing the scope to specific groups) to ensure that notifications remain actionable and focused on the most critical issues.