This article covers how to see real-time and client metrics from Remote Clients (formerly Remote DX).
See Real-Time Client Metrics
You can see Remote Clients client metrics using the VDI App or the Real-Time DX Console.
Remote Clients Preset
To see real-time client metrics in the web console:
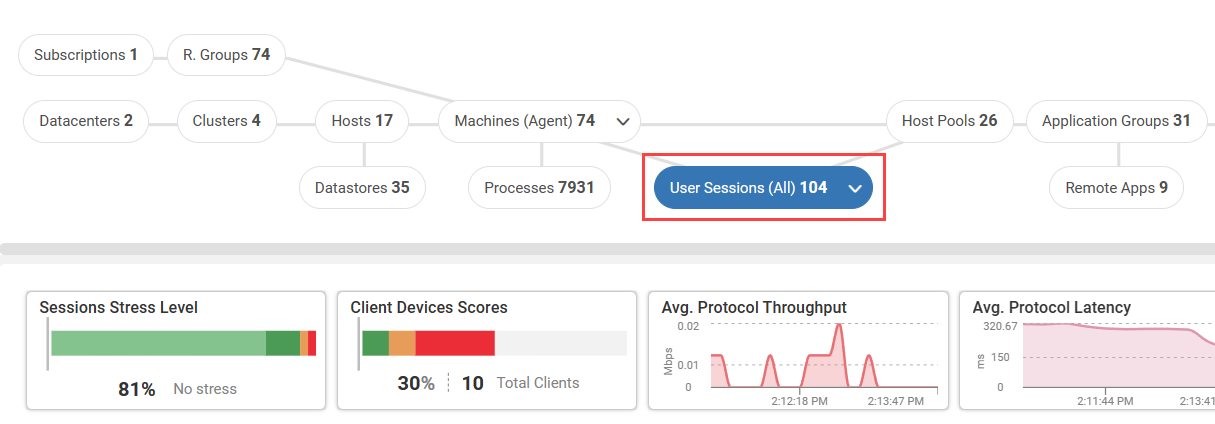
- Go to the Discovery page and select User Sessions from the topology.
- At the top-right of the grid, set the column preset to Remote DX.
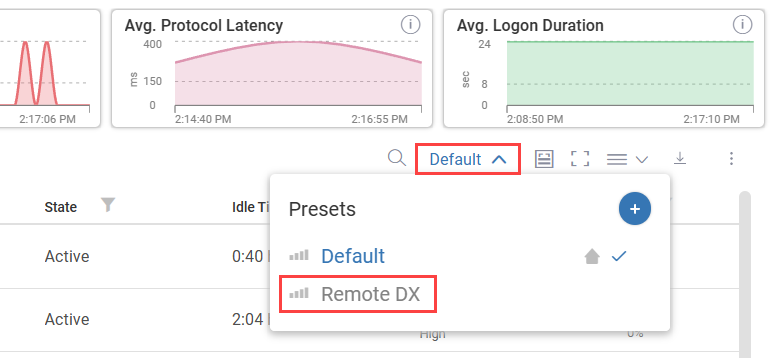
The Remote DX preset shows all client device columns for your active user sessions. You can also use the column picker to add or remove Remote Clients metrics from any column preset.
The Real-Time Console also has a Remote DX preset under the Sessions tab to see all Remote Clients metrics.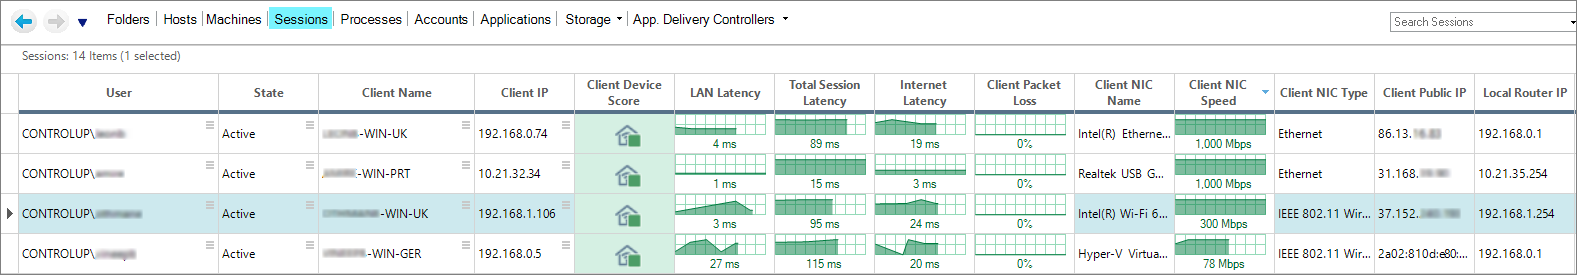
Client Connection Details
In the web console, click the house icon under the Client Device Score column to see connection details for client devices that are not performing well.
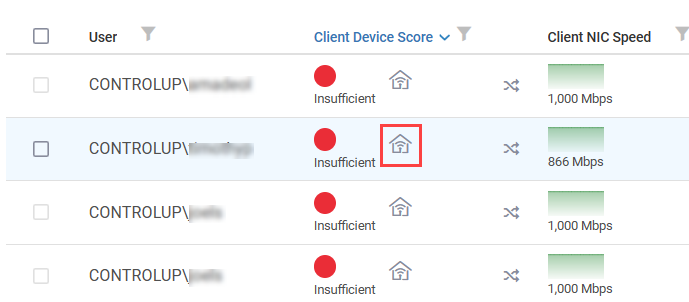
The device's connection to the virtual environment is displayed, including various segments of the connection path.
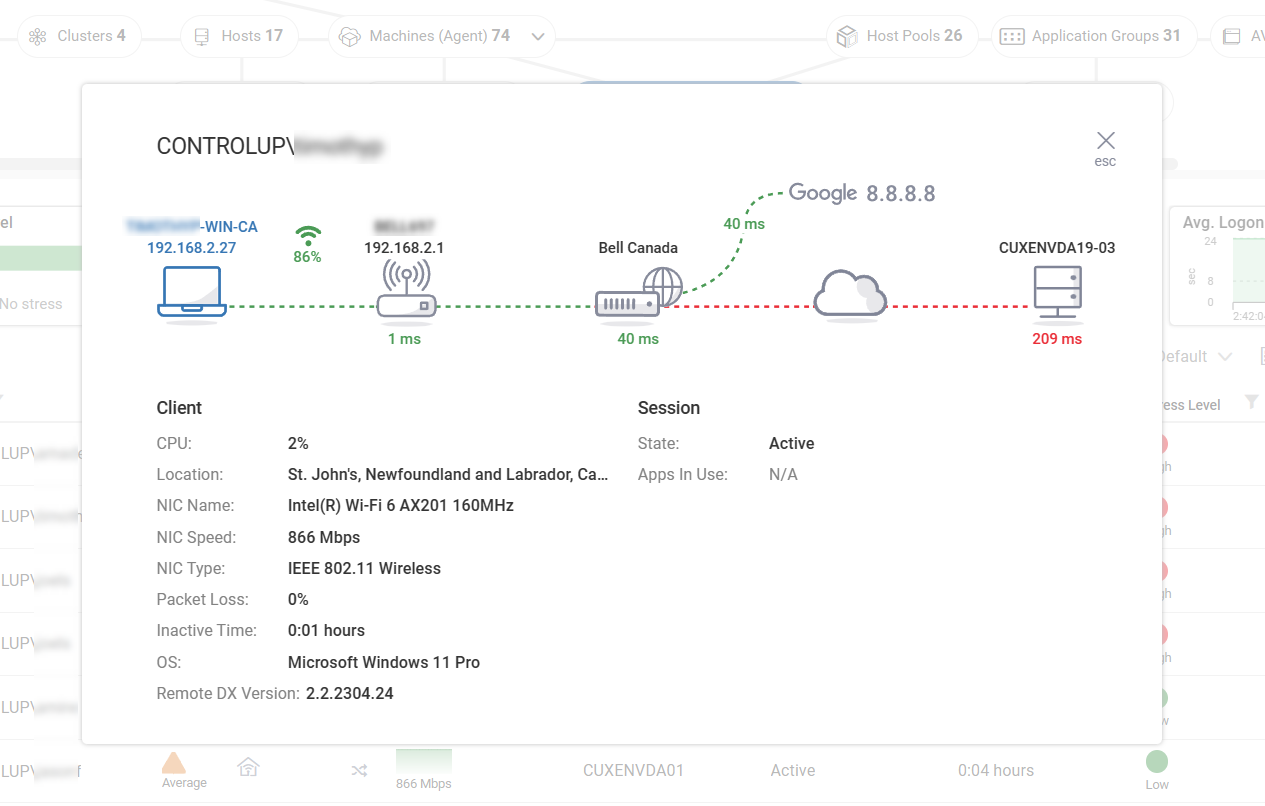
If the client device has the Edge DX Agent installed, then the device icon in the Remote Clients connection details window is blue, as shown in the image above. Click on the device icon to drill down into Edge DX and see more information and perform actions on the client device.
See Client Metrics
To see client device metrics:
-
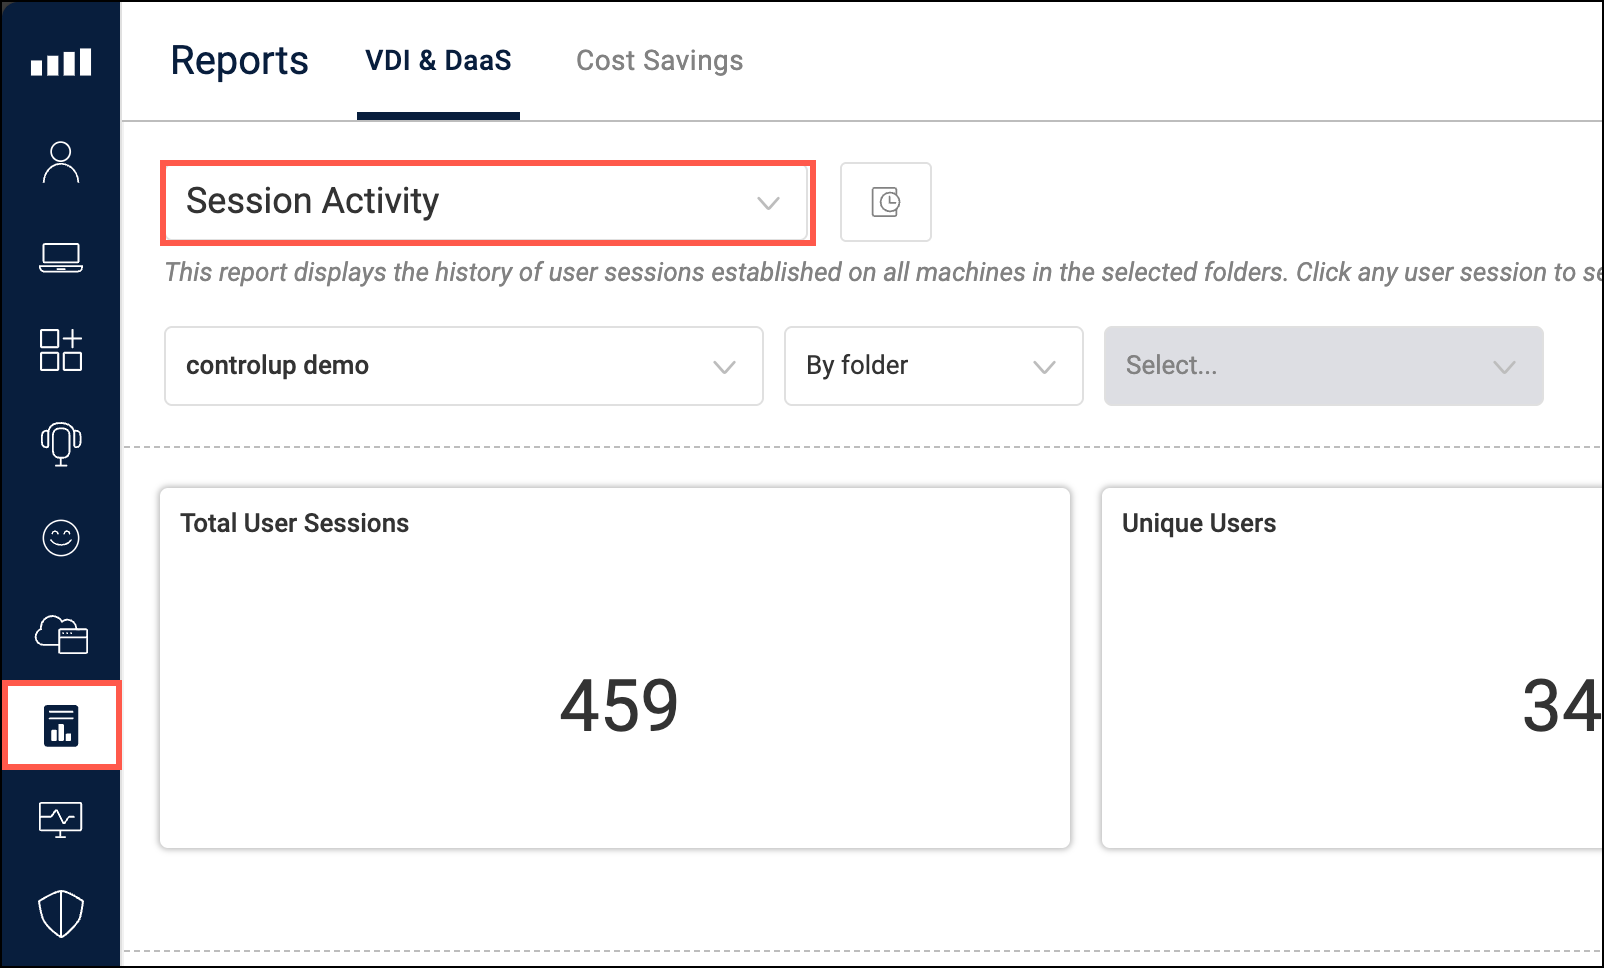
In the web console, click the Reports icon and open the Session Activity report to see user sessions in your environment.
-
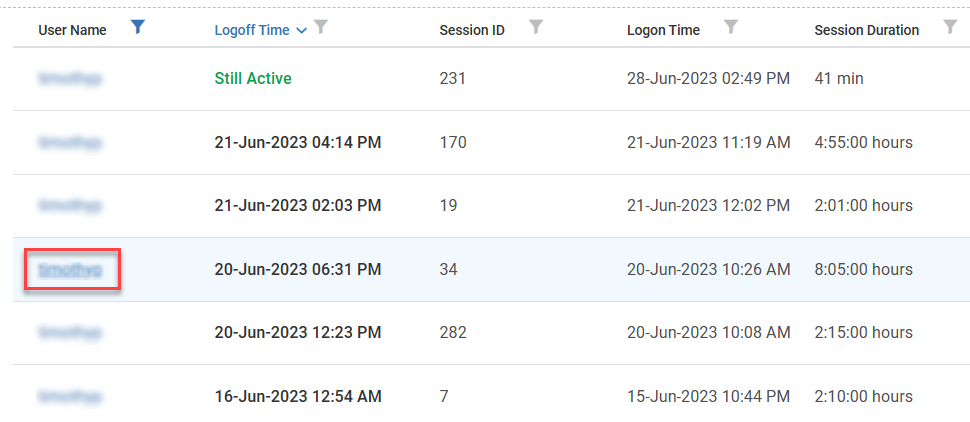
Click on the User Name field for a session to drill down into the Session Details.
-
In the Session Details page, scroll down to the Remote DX section to see the network latency, WiFi signal strength, and client packet loss throughout the duration of the session.
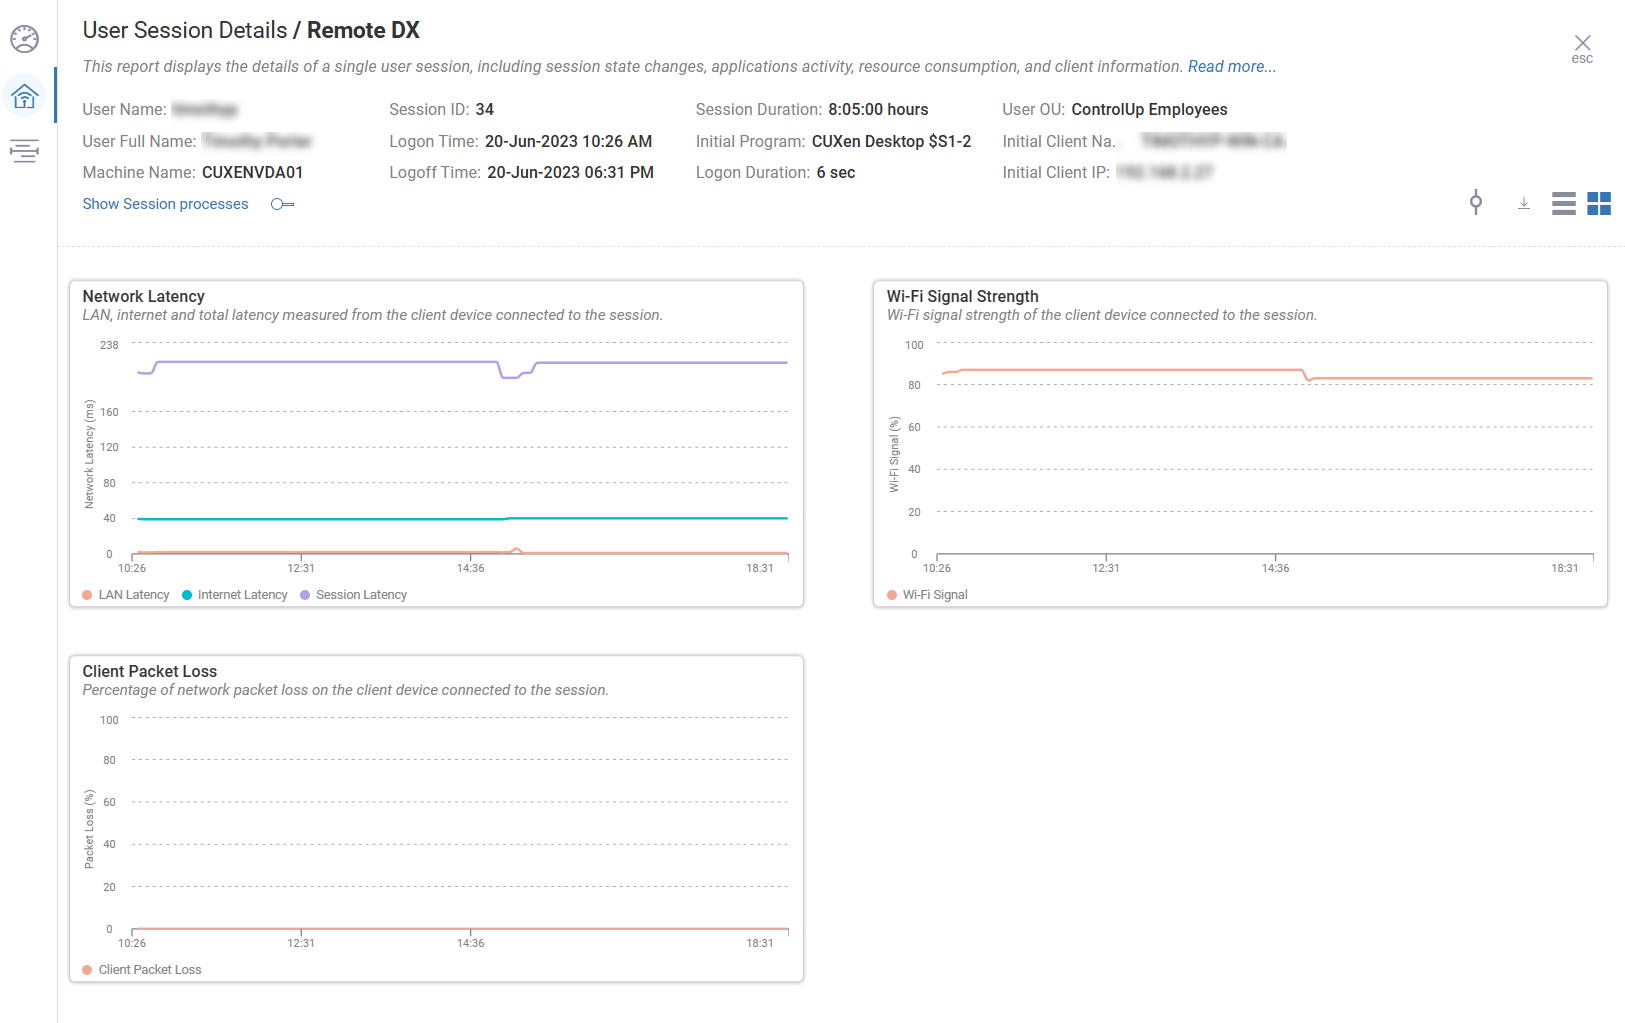
To learn more, visit Session Activity Historical Report or User Session Details Report.