Use Remote Clients (formerly Remote DX) to monitor metrics such as CPU usage and WiFi signal strength from client devices that are logged into your virtual environment. Remote Clients gives you visibility of user client devices regardless of where they work or what type of workspace they use.
Client metrics are collected by the Remote Clients plugin when the client has an active session on an AVD, Citrix, or Omnissa Horizon (formerly VMware Horizon) machine with the ControlUp for VDI Agent installed. The Remote Clients plugin sends data to the Agent, which can then be viewed in the ControlUp interface. For full details on supported client operating systems for each platform, see Remote Clients Support Matrix.
Requirements
The client device must have:
The relevant Remote Clients plugin for the client OS and virtualization platform.
Access to the internet latency IP/DNS target to test the device's latency. The default latency target for all operating systems is 8.8.8.8. When installing the Windows plugin, you can set a custom latency target.
Access to https://fabric.controlup.com to collect client location and ISP data.
The virtual machine must have:
The virtual machine must have the Microsoft Visual C++ Redistributable (vc_redist_x64) package installed to support the loading of unmanaged C++ DLLs.
Data Flow
The following diagram shows the data flow for Remote Clients with the different ControlUp components: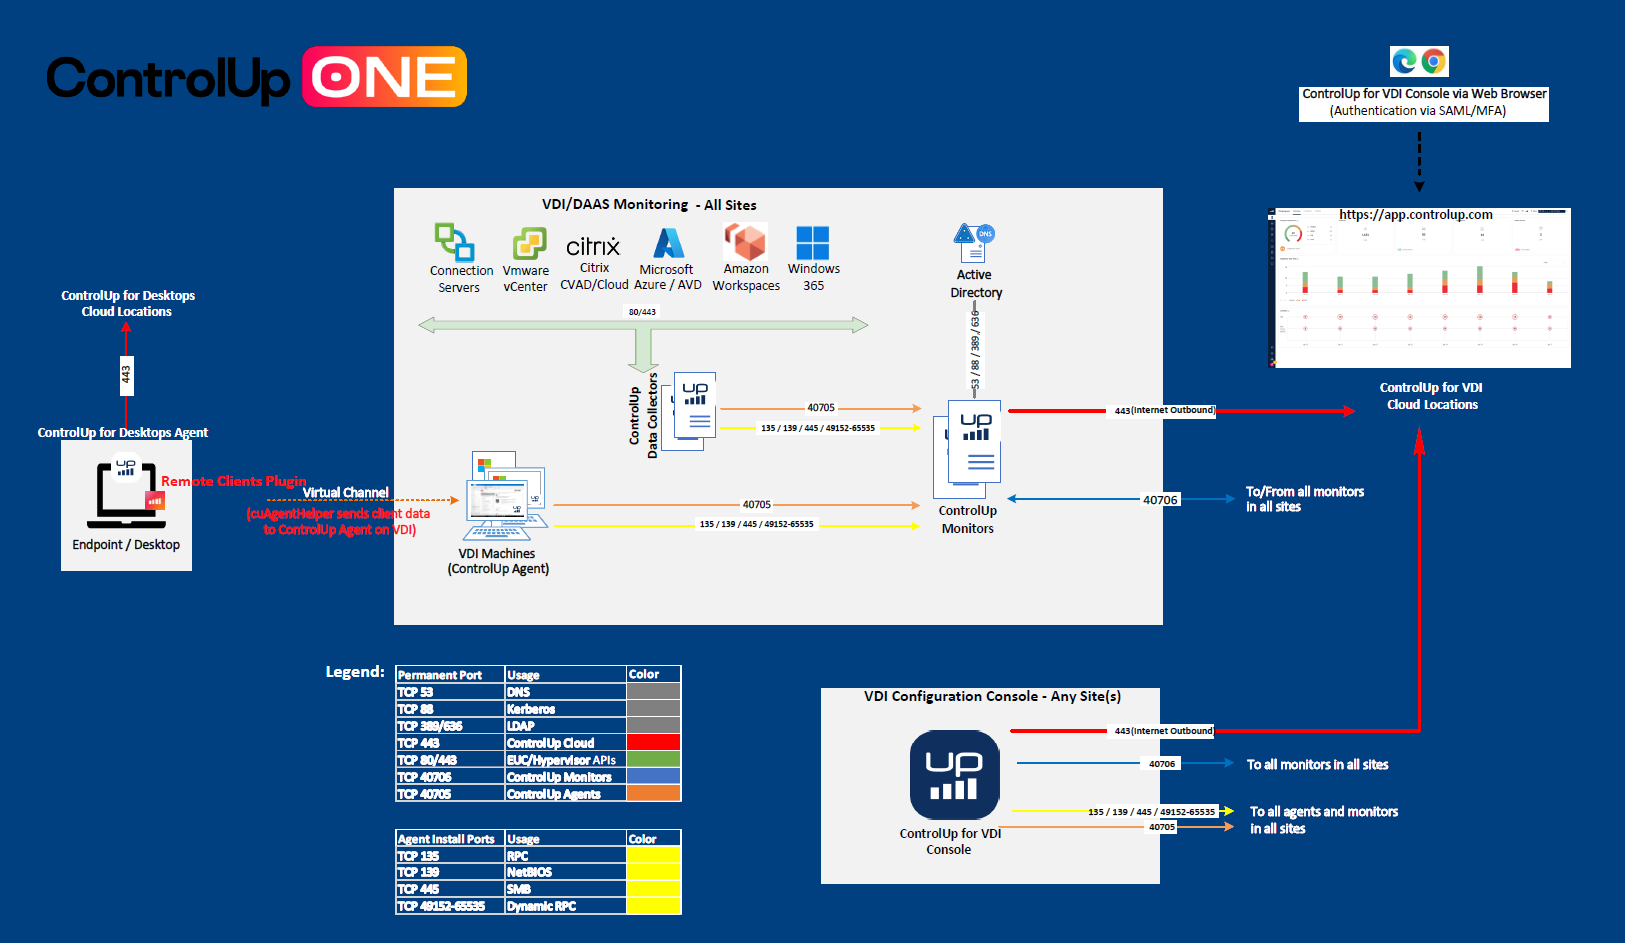
Install the Remote Clients Plugin
Learn how to install the Remote Clients plugin for:
Collected Client Device Metrics
| Metric Name | Description | Note |
|---|---|---|
| CPU utilization of the client device connected to the session | ||
| EUC client's inactive time while the client device is connected to the session | ||
| IP address of the client machine connected to the session | ||
| Geographical location of the client device connected to the session based on the public IP | Client devices need access to https://fabric.controlup.com | |
| NIC name of the client device connected to the session | ||
| NIC speed of the client device connected to the session | ||
| NIC type of the client device connected to the session | ||
| OS type of the client device connected to the session | ||
| OS Version of the client device connected to the session | ||
| Percentage of network packet loss on the client device connected to the session | ||
| Public IP Address of the client device connected to the session | ||
| Latency between the client device connected to the session and the internet latency target. | Default latency target for all operating systems is 8.8.8.8. When installing the Windows plugin, you can set a custom latency target. | |
| Latency between the client device connected to the session and closest ISP router | Client devices need access to https://fabric.controlup.com | |
| ISP Name | Client devices need access to https://fabric.controlup.com | |
| Latency between the client device connected to the session and the local router | ||
| Client device's local router IP while connected to the session | ||
| The Remote Clients client version installed on the client device connected to the session | ||
| Total session latency from the client device calculated from the second callback | ||
| Authentication type used to connect to the wireless network by the client device connected to the session | ||
| MAC address of the access point to which the client device is currently connected | ||
| Access point channel of the client device connected to the session | ||
| Radio protocol/type of the wireless network used by the client device connected to the session | ||
| WiFi signal strength of the client device connected to the session measured in dBm displayed in percentage | ||
| Name of the connected wireless network used by the client device connected to the session |
Client Device Score
In the Real-Time DX Console, the Client Device Score metric is displayed with a colored  icon:
icon:
Client Device Score indicates the connectivity performance of a device, displaying the lowest value among the following metrics:
Client WiFi Signal
LAN Latency
Total Session Latency
Internet Latency
Client CPU
ISP Latency