Webhooks are automated HTTP callbacks that send notifications to external systems when a specific event occurs. In ControlUp Synthetic Monitoring, you use webhooks to alert ticketing systems, if configured in the scout’s Alert Policy, when a scout reaches specific alerting conditions. This allows for real-time notification and automated remediation.
When Are Webhooks Triggered
A webhook is triggered when the scout’s configured alert meets the alerting condition.
For example:
A test fails
A threshold is breached
A recovery occurs after a failure
Prerequisites
Before you start, make sure you have:
A configured endpoint URL from the target system
Any required authentication details (for example, an API token)
Step 1 - Prepare the Webhook Endpoint
Before configuring the alert, ensure your webhook provider is set up.
In the target system, follow these steps:
Create or identify the endpoint that will receive the webhook
Note the required HTTP method (POST)
Confirm whether authentication headers are required
Step 2 - Configure a Webhook for a Scout
After configuring the webhook in the target system, you can now set up the webhook in the scout’s Alert Policy.
To do so, follow these steps:
In Synthetic Monitoring, navigate to the scout’s Alert Policy.
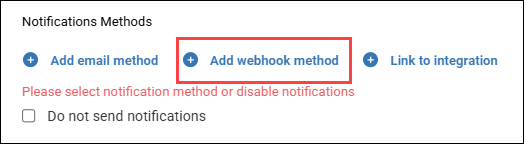
Under Notification Methods, select Add webhook method.
In the configuration window, enter the Endpoint Address. This is the unique URL of the external service that will receive the webhook payload.
For example:
https://webhook.site/cxxxxa-2345-4778-9765-8xxexxxx.Select the Authentication Method required by your provider:
None
Basic (Username and Password)
API Token
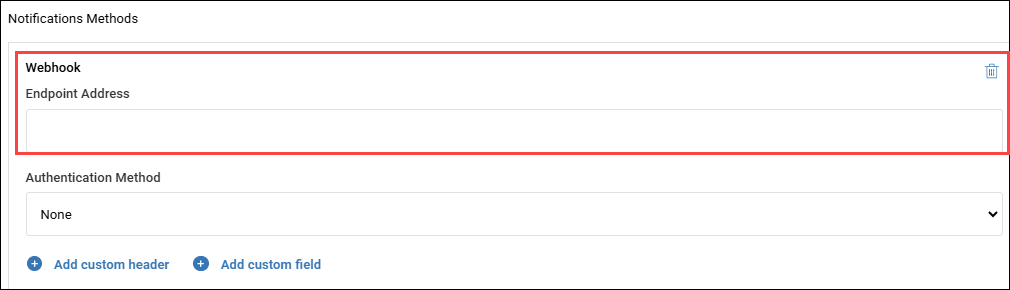
Add Custom Headers (Optional): Headers provide metadata about the request itself.
Custom headers allow the sending system to pass details that the receiving server needs to process the request correctly without having to scan the entire data body.
The typical Structure of a custom header consists of a Key and a Value:
Key: The name of the header (e.g.,
Content-TypeorX-ControlUp-Token).Value: The specific data associated with that name (e.g.,
application/jsonor a unique alphanumeric string).
Add Custom Fields (Optional): Define specific data fields (such as event type, ID, status, payload details) to send in the JSON payload.
This is especially important for services that require a specific JSON payload format.
To create a property, do the following:
Name field: Use a dot notation for the name field.
For example, to create a field for a payload, usepayload.summary.Value field: You can use plain text, such as
Disk at 99% on machine,or ControlUp's built-in Webhook Variables to dynamically insert data from the Scout test results.
Example payload
{
"scoutName": "{scout.name}",
"testStatus": "{test.status}",
"failureReason": "{test.failure_reason}",
"timestamp": "{test.time}"
}
Notes:
A property that is incorrectly injected will be ignored and replaced with an empty string.
Custom Headers and Custom Fields are clear (unencrypted) texts.
Webhook Variables
You can use the following variables in your custom fields to include real-time data in your notifications:
Variable | Description |
|---|---|
{scout.id} | The Scout's ID value |
{scout.resource} | The name of the resource being tested by the Scout (for EUC Scouts) |
{scout.name} | The Scout’s name |
{scout.user} | The user name configured for authenticating the Scout (for EUC Scouts) |
{scout.address} | The address of the tested resource or gateway |
{scout.location} | Name of the cloud or custom hive where the scout runs |
{test.ready_phase} | The duration for getting to the Session Ready state from the tested published resource (for EUC Scouts) |
{test.server_name} | The server on which the Scout's session was opened (for EUC Scouts) |
{test.start_time} | The start time of the test |
{test.state_count} | How many times in a row the trigger has been triggered |
{test.status} | The status of the test (success/failure) |
{test.status_percents} | The success percentage of the test |
{test.body_size} | Response body size (HTTP Scouts) |
{test.cert_exp_date} | Certificate expiration date (HTTP Scouts) |
{test.connect_time} | Connect duration of the HTTP request (HTTP Scout) |
{test.dest} | Destination address of the HTTP request (for HTTP Scouts) |
{test.latency} | Total response time of the HTTP request (for HTTP Scouts) |
{test.namelookup_time} | DNS lookup duration of the HTTP request (for HTTP Scouts) |
{test.redirect_time} | Redirect/s duration of the HTTP request (for HTTP Scouts) |
{test.response_time} | Response duration of the HTTP request (for HTTP Scouts) |
{test.tls_handshake_time} | TLS handshake duration of the HTTP request (for HTTP Scouts) |
{test.ttfb} | Time to First Byte of the HTTP request (HTTP Scouts) |
{test.status_code} | The status code of the HTTP request (for HTTP Scouts) |
{test.query_type} | The DNS query type {DNS Scouts} |
{test.result} | The responded records of the DNS query (for DNS Scouts) |
{test.runtime} | The total duration of the DNS query (for DNS Scouts) |
{test.server} | The DNS server being used for the query (for DNS Scouts) |
{test.packets_sent} | Number of packets sent during the test (for Ping Scouts) |
{test.packets_received} | Number of packets received during the test (for Ping Scouts) |
{test.jitter} | The average jitter time of all sent packets (for Ping Scouts) |
{test.avg_rtt} | The average latency of the test (for Traceroute and Ping Scouts) |
{test.min_rtt} | The lowest total latency of all packets sent during the test (for Traceroute and Ping Scouts) |
{test.max_rtt} | The highest total latency of all packets sent during the test (for Traceroute and Ping Scouts) |
{test.hops} | Number of hops the packets went through (for Traceroute Scouts) |
Step 3: Validate the Configuration
After saving:
Trigger the Scout (or wait for the next scheduled run).
Confirm the webhook request is received successfully.
Verify the payload values are populated correctly.
If the webhook fails, check:
Endpoint URL
Authentication headers
Payload format
How it Works (Use Case)
Event: A new customer signs up on your website.
Trigger: Your system sends a webhook (HTTP POST request).
Payload Properties: This request has a JSON body containing properties like:
event: customer_registereduserId: 12345email: user@example.comtimestamp: 2025-12-18T10:00:00Z
Delivery: This payload goes to your app's registered URL, which then uses those properties to add the user to a welcome email sequence.
Best Practices and Considerations
Testing: Currently, there is no in-platform "Test" button for webhooks within the Alert Policy configuration. The only way to test is to wait for the Scout to run and meet the alert conditions, which can take several minutes. You can also use third-party tools like Postman.
Routing Keys: If your external system, like PagerDuty, requires a routing key, add it as a custom field. There is no dedicated field for this, so you must enter the field name as
routing_keyand its value as a clear (unencrypted) text string.
Note: For more complex integrations or to automate remediation, you may want to use ControlUp's workflows and scripting capabilities, which can be triggered by webhooks.