The NetScaler report shows the usage trends of the NetScaler appliances in your organization by summarizing data about past activity and performance. You can view the data either individually for each appliance, or in summary form, for all selected appliances. By default, the selected time frame is the previous 24 hours.
Use the report to answer questions such as:
- Which NetScalers were available during the selected time frame?
- Is the workload shared evenly among my organization's NetScalers?
- Were there any configuration changes on our NetScaler appliances and, if so, when did they occur?
- Is a NetScaler itself causing bottlenecks?
To learn more about the NetScaler report, watch our video.
Report Functionality
The report provides the following functionalities:
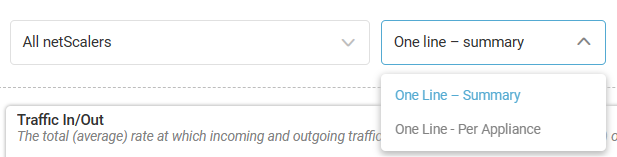
- Displays data in two views. Select to view to plot all selected appliances on the graphs individually, or as a summary of all selected appliances:
- One Line - Summary. By default, plots all selected appliances as a single line. If the metric is a percentage, the value is the average of the percentages of all selected appliances. For all other metrics, the value is the sum of the average values of all selected appliances.
- One Line - Per Appliance. Plots all selected appliances individually.
The graph display mode does not affect the grid at the bottom of the report.
- Hover over a chart to display the metrics of each data point in the popover.
- You can click a data series name on the bottom of the chart to highlight or toggle the series on the chart.
The report displays the following charts:
- Traffic In/Out. Total (average) rate at which incoming and outgoing traffic were handled by the NICs of all (each) of the selected NetScaler appliances together (individually), in Mbps.
- Packet CPU. Average packet-CPU utilization of all (each) of the selected NetScaler appliances, as a percentage.
- Memory. Average memory utilization of all (each) of the selected NetScaler appliances, as a percentage.
- HDX Sessions. Total (average) number of HDX sessions underway on all (each) of the selected NetScaler appliances together (individually).
- Management CPU. Average utilization of management CPU on all (each) of the selected NetScaler appliances, as a percentage.
Column Descriptions
The NetScaler report contains the following columns. You can click a NetScaler name to display the details of the selected appliance in the grid.
| Column | Description |
NetScaler Name | Name of the NetScaler. |
Management IP | IP address used to connect to the NetScaler. |
Packet CPU | Average CPU utilization of the NetScaler appliance, as a percentage. |
Memory Used | Average memory utilization on the NetScaler appliance, as a percentage. |
% of LBs Up | Average proportion of active Load Balancers relative to the total number of Load Balancers on the NetScaler appliance, as a percentage. Click the value to open the NetScaler Load Balancing report for this NetScaler. |
% of GWs Up | Average proportion of active Gateways relative to the total number of Gateways on the NetScaler appliance, as a percentage. Click the value to open the NetScaler Gateway report for this NetScaler. |
Traffic In | Average rate of incoming traffic through all the NICs on the NetScaler appliance, in Mbps. |
Traffic Out | Average rate of outgoing traffic through all the NICs on the NetScaler appliance, in Mbps. |
HDX Sessions | Average number of HDX sessions on the NetScaler appliance. |
Version | Version number of the NetScaler software running on the NetScaler. |
| Build | Version number of the build. |
Management CPU | Average management-CPU utilization of the NetScaler appliance, as a percentage. |
# of LBs | Average count of Load Balancers on the NetScaler appliance. Click the value to open the NetScaler Load Balancing report for this NetScaler. |
# of GWs | Average count of Gateways on the NetScaler appliance. Click the value to open the NetScaler Gateway report for this NetScaler. |
HA Current Node State | High Availability state of the NetScaler (primary, secondary). |
HA Sync Failures | Number of times the configuration of primary and secondary failed to synchronize since the last transition. Note This counter resets when a connection between the pair of nodes is established. |
HA Heartbeats Receive Rate | Average number of heartbeat packets the NetScaler received from its High Availability peer node. |
HA Heartbeats Send Rate | Average number of heartbeat packets the NetScaler sent to its High Availability peer node. |