The employee experience drilldown provides a unified view to let helpdesk administrators quickly investigate and resolve an empoyee's IT issues. This feature offers a timeline of events, contextual insights, and remediation tools - all in one place.
The drilldown's Virtual Expert feature lets you provide your helpdesk administrators with relevant guidance, resources, and one-click remediation actions that are tailored to the specific event or issue they are investigating.
Accessing the Employee Experience Drilldown
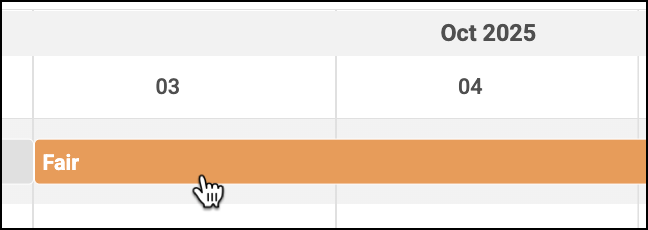
You can open the Employee Experience drilldown from the Experience over time widget on an employee's dashboard. Click on a specific experience score to open the overlay. Note that the drilldown is not accessible when the employee's score is Perfect.
Sections of the Drilldown
The drilldown organizes information into five key sections, described below.
Summary
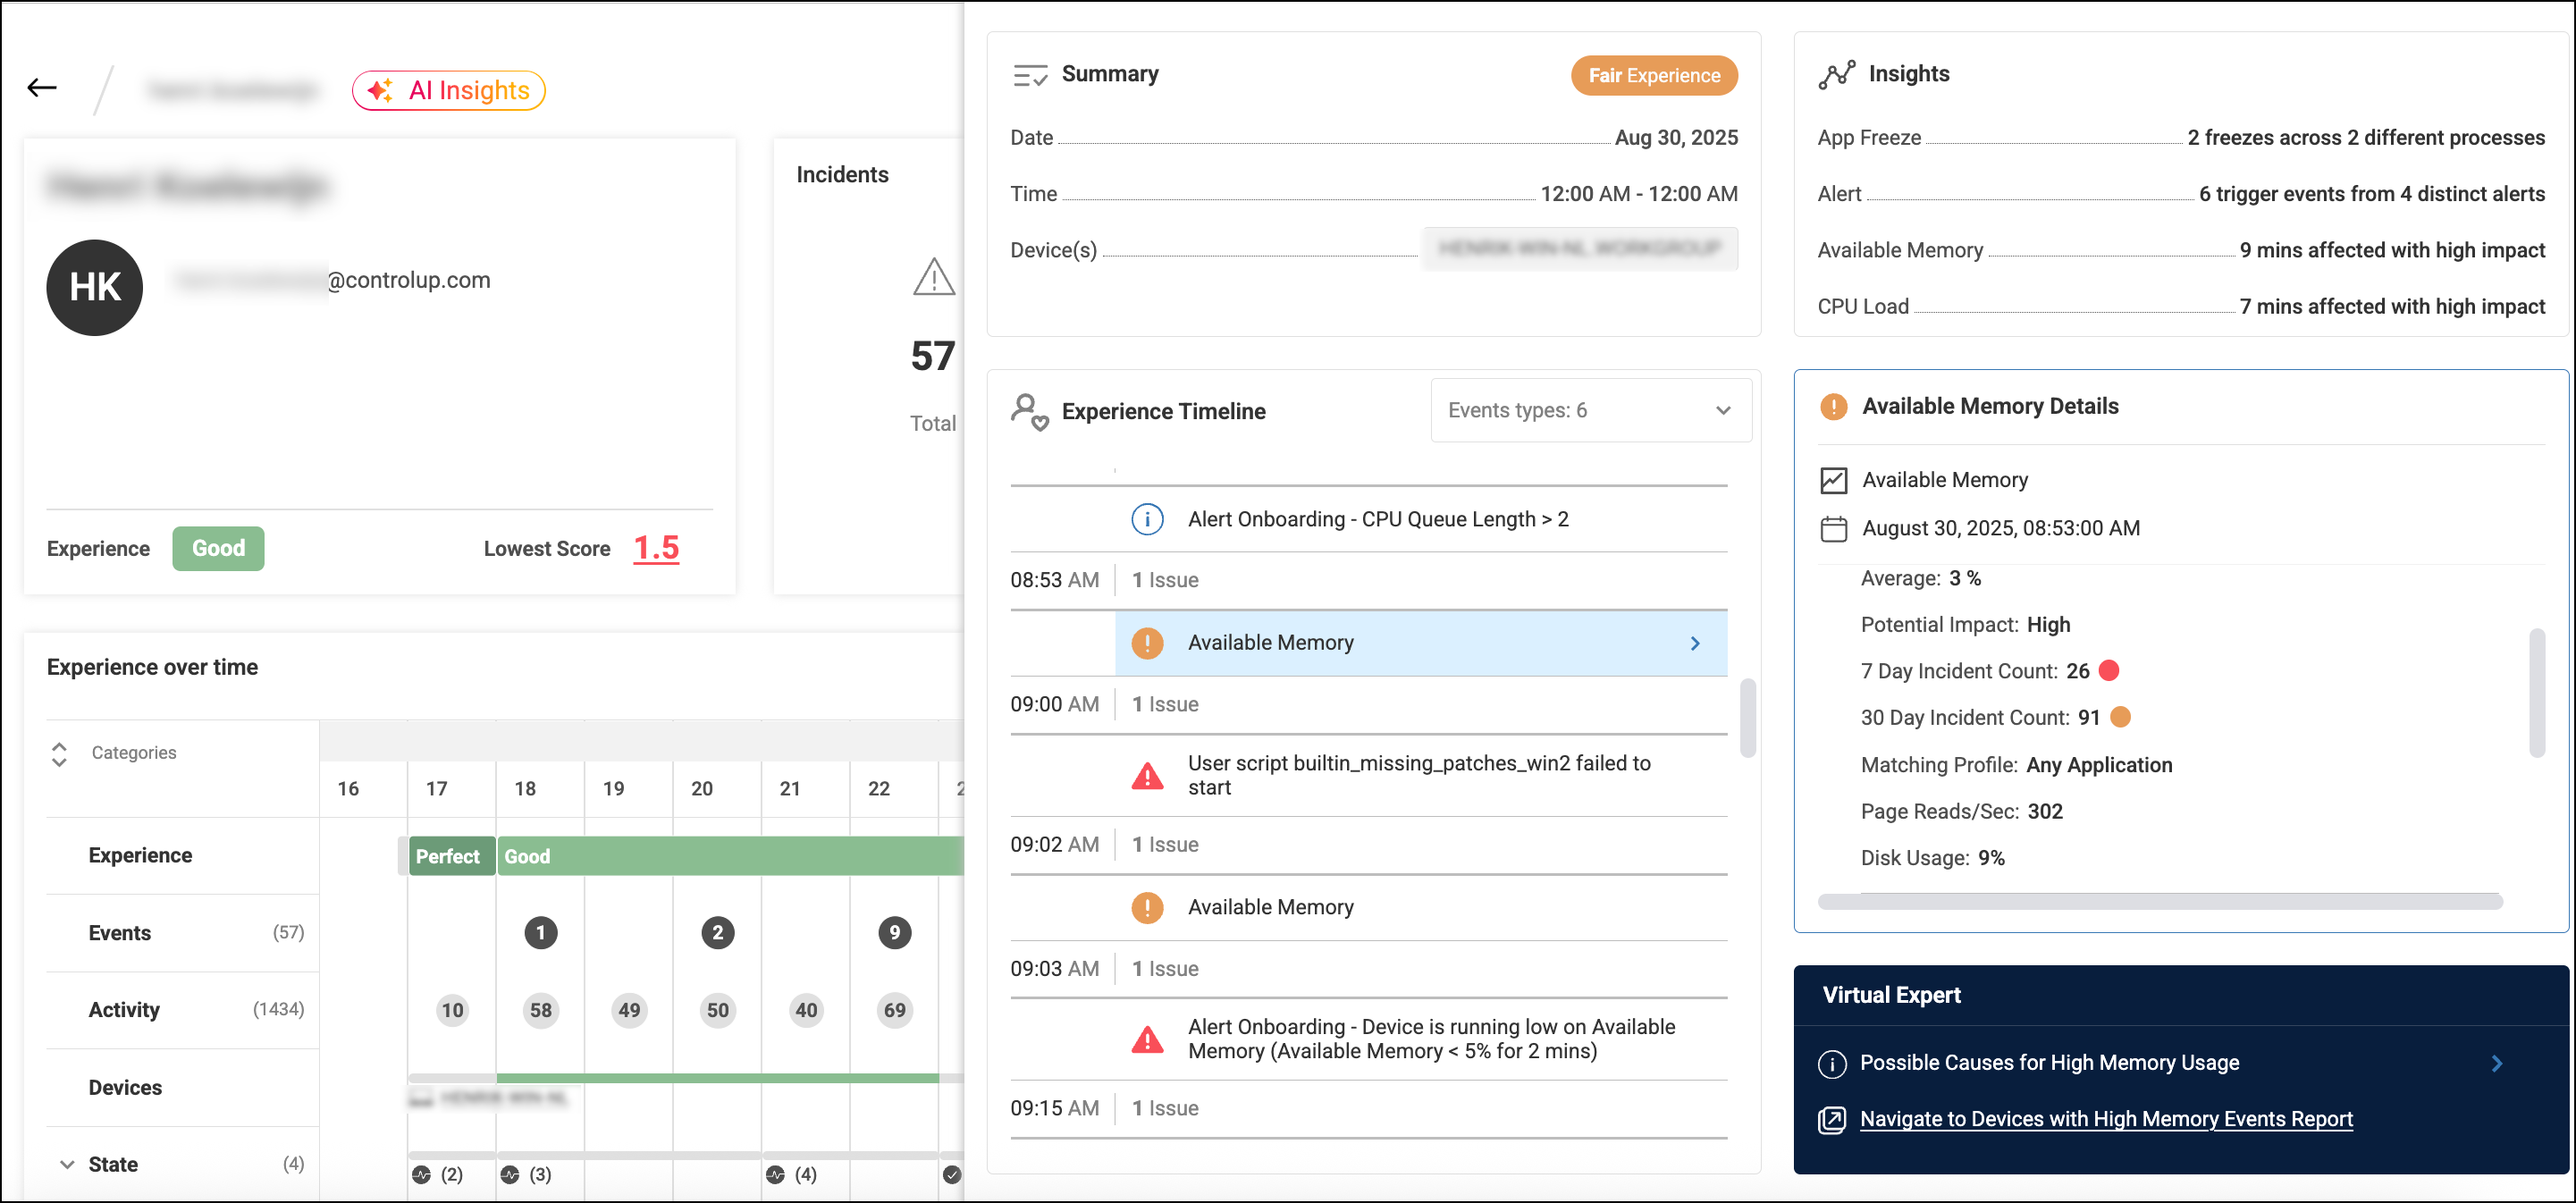
The Summary widget shows an overview of the data, including the Time Frame, Overall Experience Score, and a device selection option for Employees using multiple devices.
Insights
The Insights widget provides a high-level summary of alerts and incidents that occurred during the selected time frame. This allows you to quickly see the most impactful events before diving into the details. For example, it might show "chrome.exe crashed 4 times" or "20 high CPU load events," helping you to immediately understand the nature of the problem.
Experience Timeline and Details
This is the core of the drilldown, offering a chronological view of all noteworthy events on the device.
-
Timeline: Shows a consolidated view of relevant events, including:
- Alerts: Triggered by the employee's device.
- Incidents: Recorded when the device breaches a condition in an experience score Profile.
- Script Executions: Scripts executed on the device.
-
Details: When you click on an event in the timeline, the Details widget on the right displays more information about it:
- For Alerts: See the severity, frequency (how many times the alert was triggered in the last 7 and 30 days), and the first time it occurred.
- For Incidents: View the specific metric that triggered the incident, its frequency (last 7 and 30 days), and the scoring profile that contained the breached rule. You can hover over the profile name to see a full list of its metric conditions.
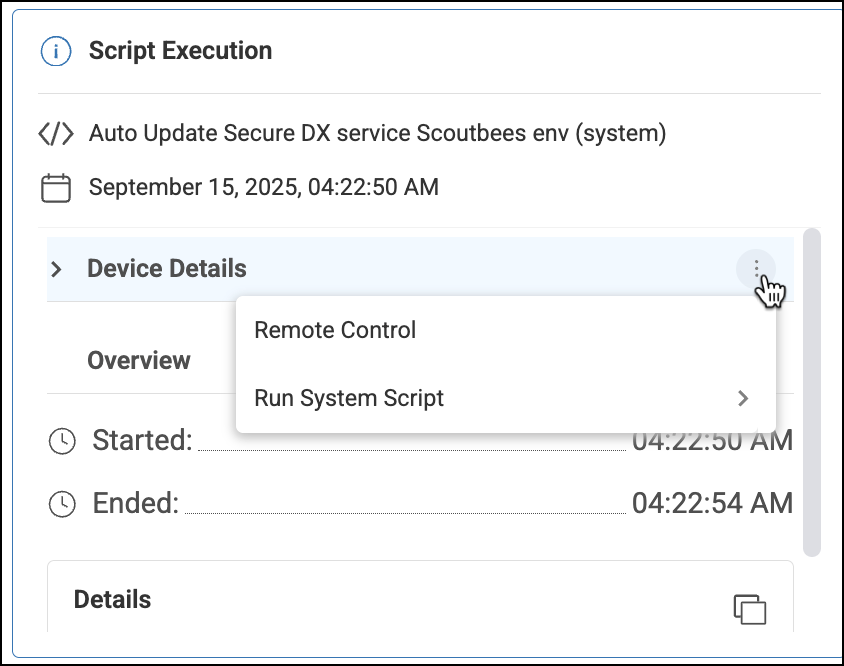
- For Scripts: See the start and finish time of the script.
Virtual Expert
Virtual Expert provides relevant guidance, resources, and one-click remediation actions tailored to the specific event you are viewing. It uses a system of mappings to determine the most helpful content to present. Some mappings are provided by default, and others can be customized to fit your organization's needs.
Learn how to configure Virtual Expert.
For example, when viewing an employee who experienced a Microsoft Teams crash, Virtual Expert can provide:
- A list of troubleshooting steps and questions to ask the employee.
- Links to relevant reports and internal knowledge base articles.
- A script to clear the Microsoft Teams cache, which can be executed directly from the drilldown.
When you execute a remediation script, the system provides live remediation tracking, showing you real-time feedback and key device metrics during the process. The output of the script is visible immediately upon completion, confirming the fix has been applied. The script output you see is the data written to the System Events log (between ### SIP EVENT BEINGS and ### SIP EVENT ENDS).
Start Remote Control and run scripts
You can start a Remote Control session and run scripts (other than the suggested script in Virtual Expert). To do this, click the three dots menu next to the Device Details.