Feature available only in version 9.2.5
This article describes monitor features only available in ControlUp Real-Time DX version 9.2.5.
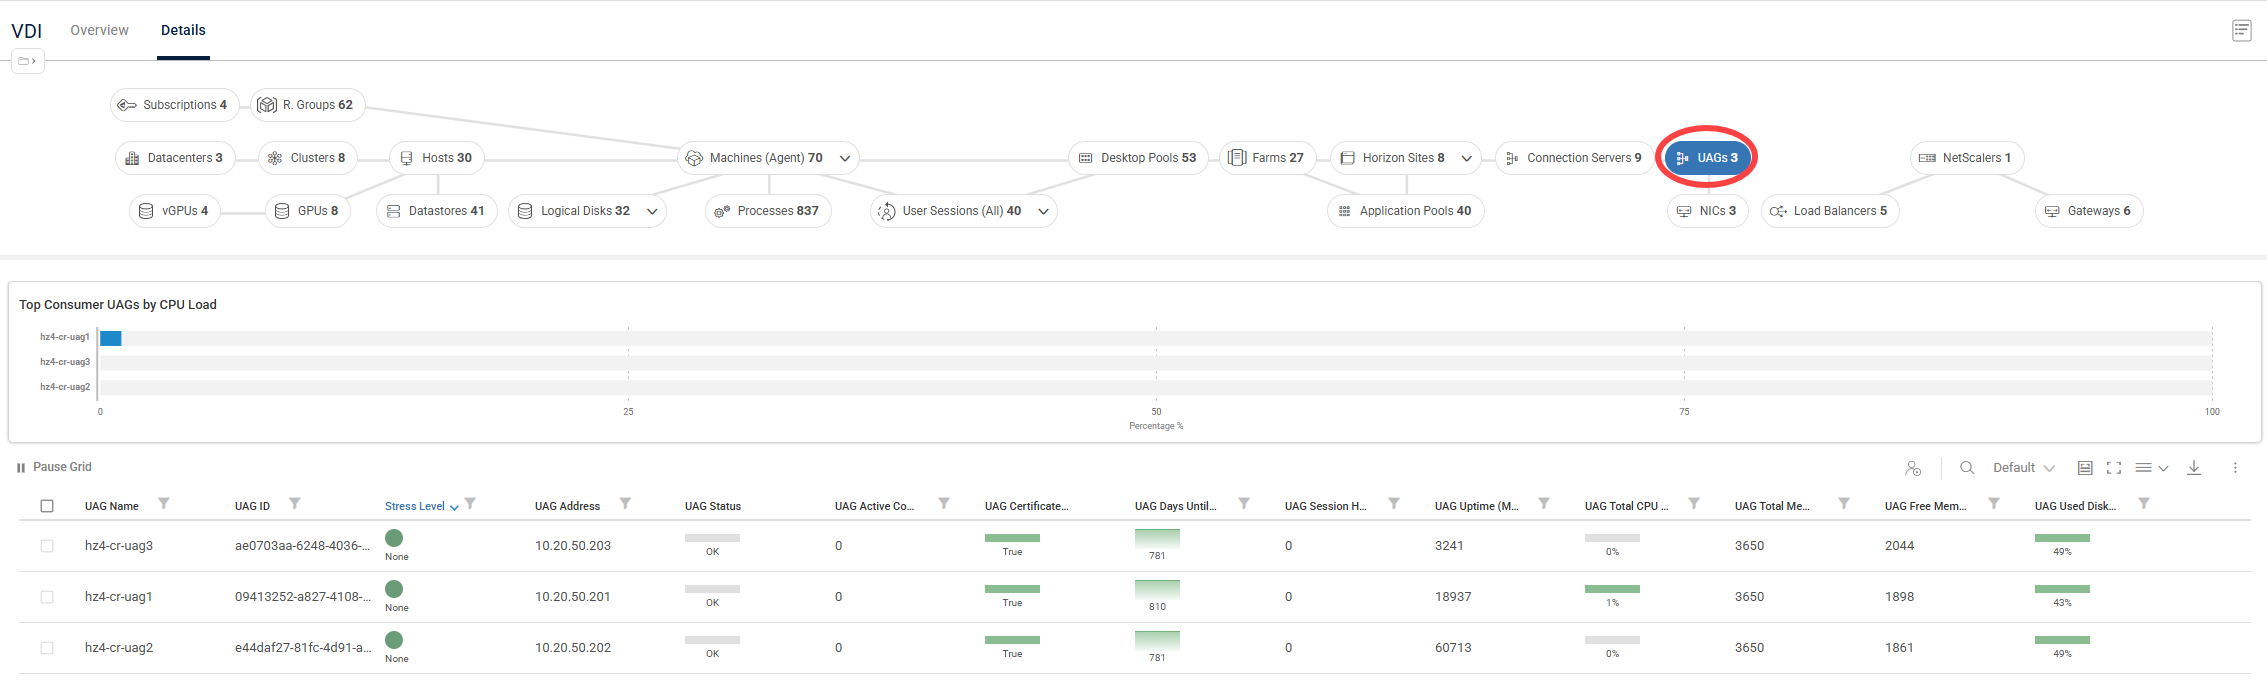
From VDI version 9.2.5, you can use ControlUp to monitor your Omnissa Unified Access Gateway (UAG) appliances directly, eliminating the need to log into individual gateways or rely on siloed tools to track DMZ health.
UAGs metrics display critical data in the Real-Time DX Console and a new cohesive UAGs dashboard.
This feature includes:
Comprehensive Real-Time Metrics: Track availability, session counts, session failures, and hardware resource utilization (CPU, memory, and disk) at a glance.
Historical Data Persistence: Metrics are automatically saved to your historical database with 5-minute, 1-hour, and 1-day aggregations for seamless trend analysis.
Native ControlUp Power: UAG appliances integrate fully with native triggers, Script-Based Actions (SBAs), and RTDX, allowing you to set up proactive alerts and accelerate troubleshooting workflows.
To view the UAGs dashboard in the VDI web UI Details page, click Connection Servers > UAGs:
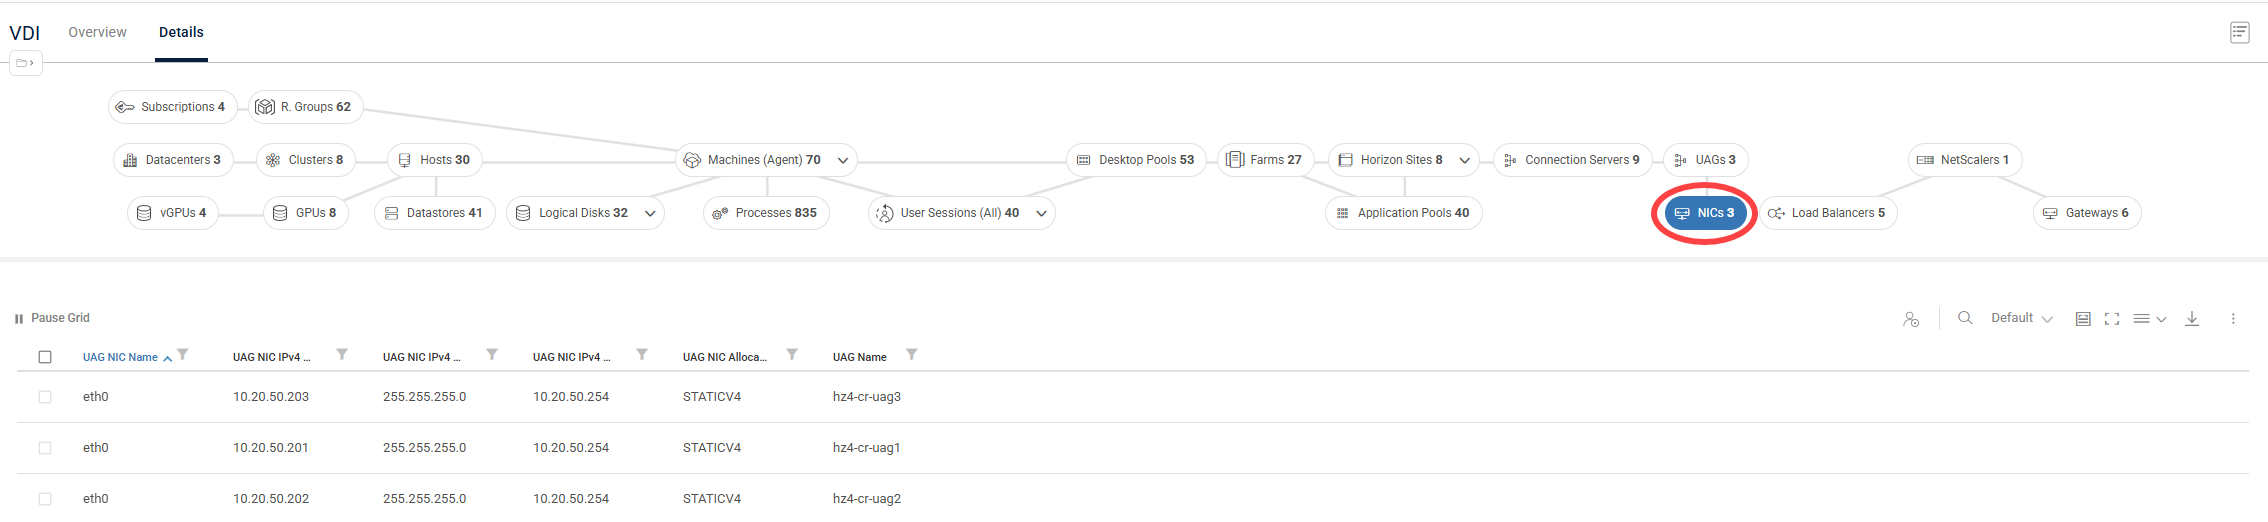
To view metrics for UAG network interface cards (NICs), click NICs:
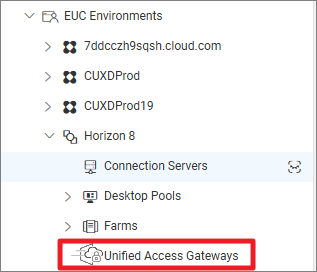
You can also drilldown to the UAGs dashboard from the folder tree by clicking EUC Environments > Horizon 8 > Unified Access Gateways:
For details about the new Omnissa Horizon UAG metrics, see here.
To add a Horizon connection in your ControlUp environment using the Real-Time DX Console, perform the steps here.