The ControlUp Stress Calculator analyses historical performance data exported from your ControlUp environment and generates recommended yellow and red stress threshold values per organizational folder. These recommendations can then be applied directly in the Real-Time DX Console's Stress Settings.
You can use the Export-CUQuery PowerShell cmdlet to calculate suggested stress thresholds for most available metrics in ControlUp.
Note that the tool produces recommendations based on your environment's own data. Always review the output before applying changes in your production environment.
Updates in Current Version
Configurable percentiles: Yellow and red thresholds are no longer fixed at 75/90. Both are adjustable per run.
Time filtering: You can filter files to working hours and weekdays, ensuring thresholds reflect production load.
Improved decimal separator handling: Detected automatically, with manual override available.
Cross-platform: Native executables available for both Windows (.exe) and macOS (.app).
Automated mode: Full CLI support for scheduled or scripted runs.
Processing indicator: Spinner next to the Process Data button gives visual feedback during longer runs.
Prerequisites
Windows or macOS machine with the calculator
At least one ControlUp Monitor installed to import the ControlUp.PowerShell.User module. Includes the Export-CUQuery Powershell cmdlet that allows you to export monitor data to a CSV file.
CSV exports from the ControlUp for VDI Web App or files generated by the Metrics Exporter script action
PowerShell version 5 or higher
Downloads
Stress Level Calculator for Windows: Download the latest version as a ZIP file:
Stress Level Calculator for macOS: Download the latest version as a DMG file:
Supported Data Sources for Monitor Calculations Exports
The Calculator works with any combination of the following CSV export types:
Place all CSV files for a single analysis run in one folder. Files from different prefixes can coexist in the same folder.
Select the Right Data to Export
Before running the Stress Calculator, determine which performance metrics you want to optimize. ControlUp allows you to export two distinct types of data depending on your operational goals:
Calculations (Real-Time Monitor Data)
Best for: Dynamic metrics that fluctuate constantly throughout a session and require frequent snapshots.
Examples: CPU utilization, memory consumption, or real-time resource performance.
Historical Data
Best for: Static metrics that are measured only once per session and remain unchanged.
Examples: Logon Duration, Profile Load Time, or initial connection speeds.
The data you select to export should align directly with the specific performance thresholds and stress levels that are most critical for your organization to track accurately.
Recommended Calculations Data
Depending on whether you need to calculate data in your environment related to hosts, user sessions, or folders, we recommend using the metrics below.
Hosts
Active memory
Consumed memory
CPU Usage %
Sessions
CPU
Memory (working and private bytes)
GPU Encoder and Decoder Utilization
GPU Frame Buffer Utilization
Non-paged Pool Memory
Memory Utilization
Pages / Sec
Virtual Disk read or write IOPS
Folders
Average CPU Usage
Average Machine Memory Utilization
Hosts CPU
Hosts Memory
Recommended Historical Data
You should export historical data that is measured once per session, such as Logon Duration or Profile Load Time. Based on whether the data is related to managed machines or user sessions, we recommend exporting the metrics below.
User Sessions Activity
Active Time %
Desktop Load Time (s)
Disconnected Time %
Group Policy Load Time (s)
Idle Time %
Logon Duration (s)
Logon Duration Others (s)
Max Latency (ms)
Profile Load Time (s)
Session Duration (s)
Session ID
Machine Statistics
CPU AVG (%)
CPU Count (#)
CPU MAX (%)
CPU MIN (%)
Disk Read Time (ms) AVG
Disk Read Time (ms) MAX
Disk Read Time (ms) MIN
Disk Transfers per sec AVG
Disk Transfers per sec MAX
Disk Transfers per sec (MIN)
Disk Write Time (ms) AVG
Disk Write Time (ms) MAX
Disk Write Time (ms) MIN
Free Space on System Drive (GB) AVG
Free Space on System Drive (GB) MAX
Free Space on System Drive (GB) MIN
Memory (GB)
Memory Utilization AVG (%)
Generate CSV Exports
Option 1: VDI Web App
In the VDI App:
Navigate to the relevant view and click the CSV export button. Repeat for each data type you want to include.
Save the CSV on the machine that runs the Stress Calculator.
Option 2: Metrics Exporter script action
Schedule the Metrics Exporter script action to run at regular intervals (e.g. every 15 minutes during business hours). This produces consistently named files with timestamps embedded in the filename, which the calculator uses for time filtering.
Recommended metrics to export:
Type | Suggested Metrics |
|---|---|
Hosts | Active memory, consumed memory, CPU usage |
Sessions | CPU, memory (working set / page file), GPU utilization, disk read/write IOPS |
Folders | Average CPU, average memory |
Logical Disks | Read/write latency, IOPS |
Historical | Logon duration, profile load time, session activity |
Use the Calculator
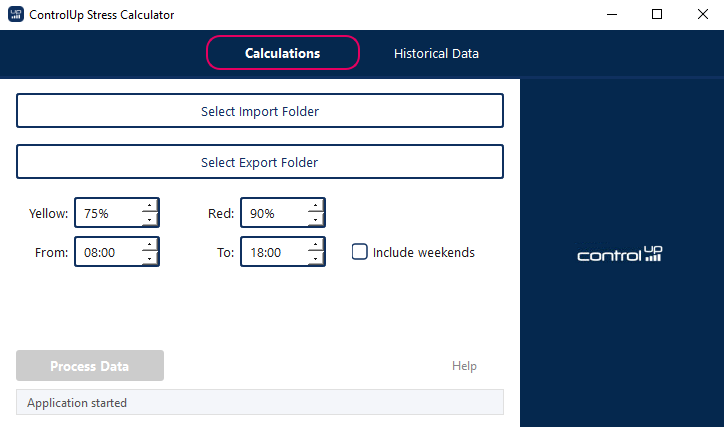
Click Select Import Folder and navigate to the folder containing your CSV exports.
Click Select Export Folder and choose where the Excel results should be saved.
Configure thresholds and filters:
Setting
Default
Description
Yellow
75%
Percentile for yellow (warning) threshold
Red
90%
Percentile for red (critical) threshold
From/To
08:00 – 18:00
Only include files collected within these hours
Include weekends
Off
When off, Saturday and Sunday files are excluded
The time filter works by reading the timestamp from each filename. Only files collected within your working hours window on the selected days are included in the calculation. This ensures thresholds reflect production-hours load rather than overnight or weekend noise.
Click Process Data. A spinner appears next to the button while processing is running, and the status bar shows which step is in progress. When complete, one Excel file per data source is written to your export folder.
Understanding the Output
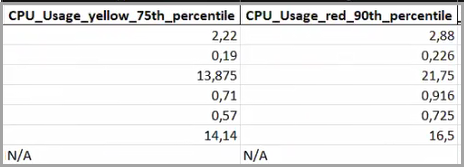
Each Excel file (e.g. Sessions.xlsx) contains:
One row per organizational folder path
One pair of columns per metric:
<Metric>_yellow_75th_percentileand<Metric>_red_90th_percentileN/Afor paths or metrics with insufficient data
These values represent the percentile of the observed metric across all collected data points for that folder during the filtered time window. Using the 75th percentile for yellow means 75% of observed values were at or below this level. The 90th percentile for red captures near-peak load.
Apply the Results
Open the Real-Time DX Console.
Navigate to Settings > Stress Settings.
For each metric, locate the corresponding folder in the exported Excel file
Enter the yellow and red values from the spreadsheet.
Run Automated Mode
The calculator can run in automated made without a GUI, suitable for scheduled tasks or CI pipelines. To set the calculator to run without a GUI, open an elevated command prompt and run the following script:
ControlUp Stress Settings Calculator.exe -import_path "C:\data\exports" -export_path "C:\data\results"Available arguments include:
Argument | Default | Description |
|---|---|---|
| N/A | Source folder (required for automated mode) |
| N/A | Destination folder (required for automated mode) |
| 75 | Yellow threshold percentile (1–99) |
| 90 | Red threshold percentile (1–99) |
| 08:00 | Working hours start (HH:MM) |
| 18:00 | Working hours end (HH:MM) |
| off | Flag — include weekend files when present |
| locale | Override decimal separator ( |
Import and Export the Data
Once you set your arguments as described above and you click OK, you see the following tab options:
Calculations. Use this tab to calculate the values for data exported from the ControlUp Monitor.
Historical Data. Use this tab to calculate the values for CSV data exported from the web interface.
Help. Access help information for running the tool.
In the Calculations tab, click Select Import Folder, or in the Historical Data tab, click Select CSV file.
Select a CSV file to import data from.
In the Calculations tab, click Select Export Folder, or in the Historical Data tab, click Export results.
Select a target folder to export data to.
In the Calculations tab, click Process data to export data to the target folder. In the Historical Data tab, the data exports automatically. Note that depending on the amount of data, it might take a while to load or seem like the tool is not responding.
Error: decimal separator
If the exported .xlsx files show the error "No exportable data found...", its means that the ControlUp Monitor exporting the data has a different decimal separator from the machine running the Stress Calculator. To fix this error, run the executable with
-decimal_separator ",", or with a period.instead of a comma,.After the data finishes processing, open the exported Excel files per metric type (computers, sessions, hosts).
For calculations data, the suggested Stress Threshold for specific metrics is displayed for both the 75th percentile (yellow) and the 90th percentile (red) in the rows of the Excel files for each folder. If the file contains no data for a metric, the value shows as N/A.
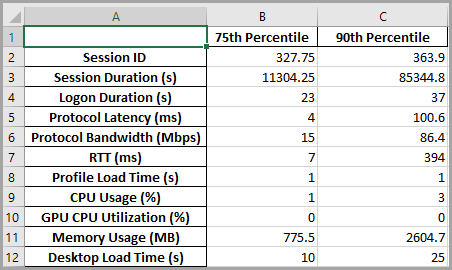
For historical data, the suggested Stress Threshold for specific metrics is displayed for both the 75th percentile (yellow) and the 90th percentile (red) in the rows of the Excel files for each metric. If the file contains no data for a metric, the value shows as empty.
In the following section, we show how to make those changes in the Real-Time Console.
Adjust Stress Thresholds Based on the Results
In the previous section, the Calculator provided suggested stress thresholds in Excel files which we need to apply in our organization. This is done from the Real-Time DX Console. Follow the steps below to apply the suggested values:
In the Console, click Settings > Stress. The Stress Level Settings window appears.
Under Folders Tree, browse the source folder that you used in the tool and select the metric.
Change the values in the Yellow and Red fields accordingly. Click Apply to save the changes.
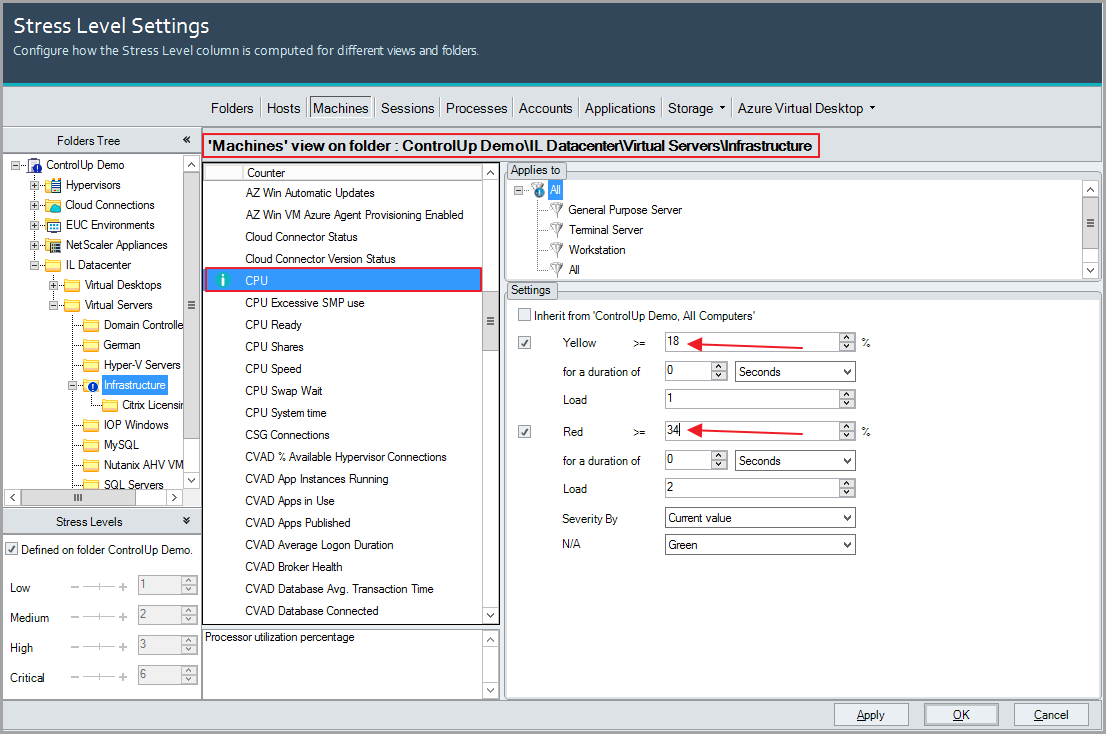
Now, the load calculation adds 1 load point for CPU between 18 and 34 percent, and 2 load points for CPU above 34 percent.
Troubleshooting
Excel output shows N/A for all values
The decimal separator in your CSV files does not match your system locale. Re-run with -decimal_separator , or . depending on your regional settings.
Fewer files processed than expected
The time filter is excluding them. Check the working hours and weekend settings, or review logging.log for the exact included/excluded file counts.
Processing completes with errors
Check logging.log in the same folder as the executable. Common causes: CSV files from an unsupported source, corrupted exports, or a missing Computers.csv (required for Sessions and Logical Disks folder mapping).