The Timeline view shows everything that happened on one device on a single shared time axis. Performance, connectivity, app crashes, system events, remote sessions, script runs, calls and app usage all appear in stacked lanes, so you can see what happened at the same moment.
Use it to answer "what was going on when the user said the device was slow?" without searching through multiple dashboards and reports.
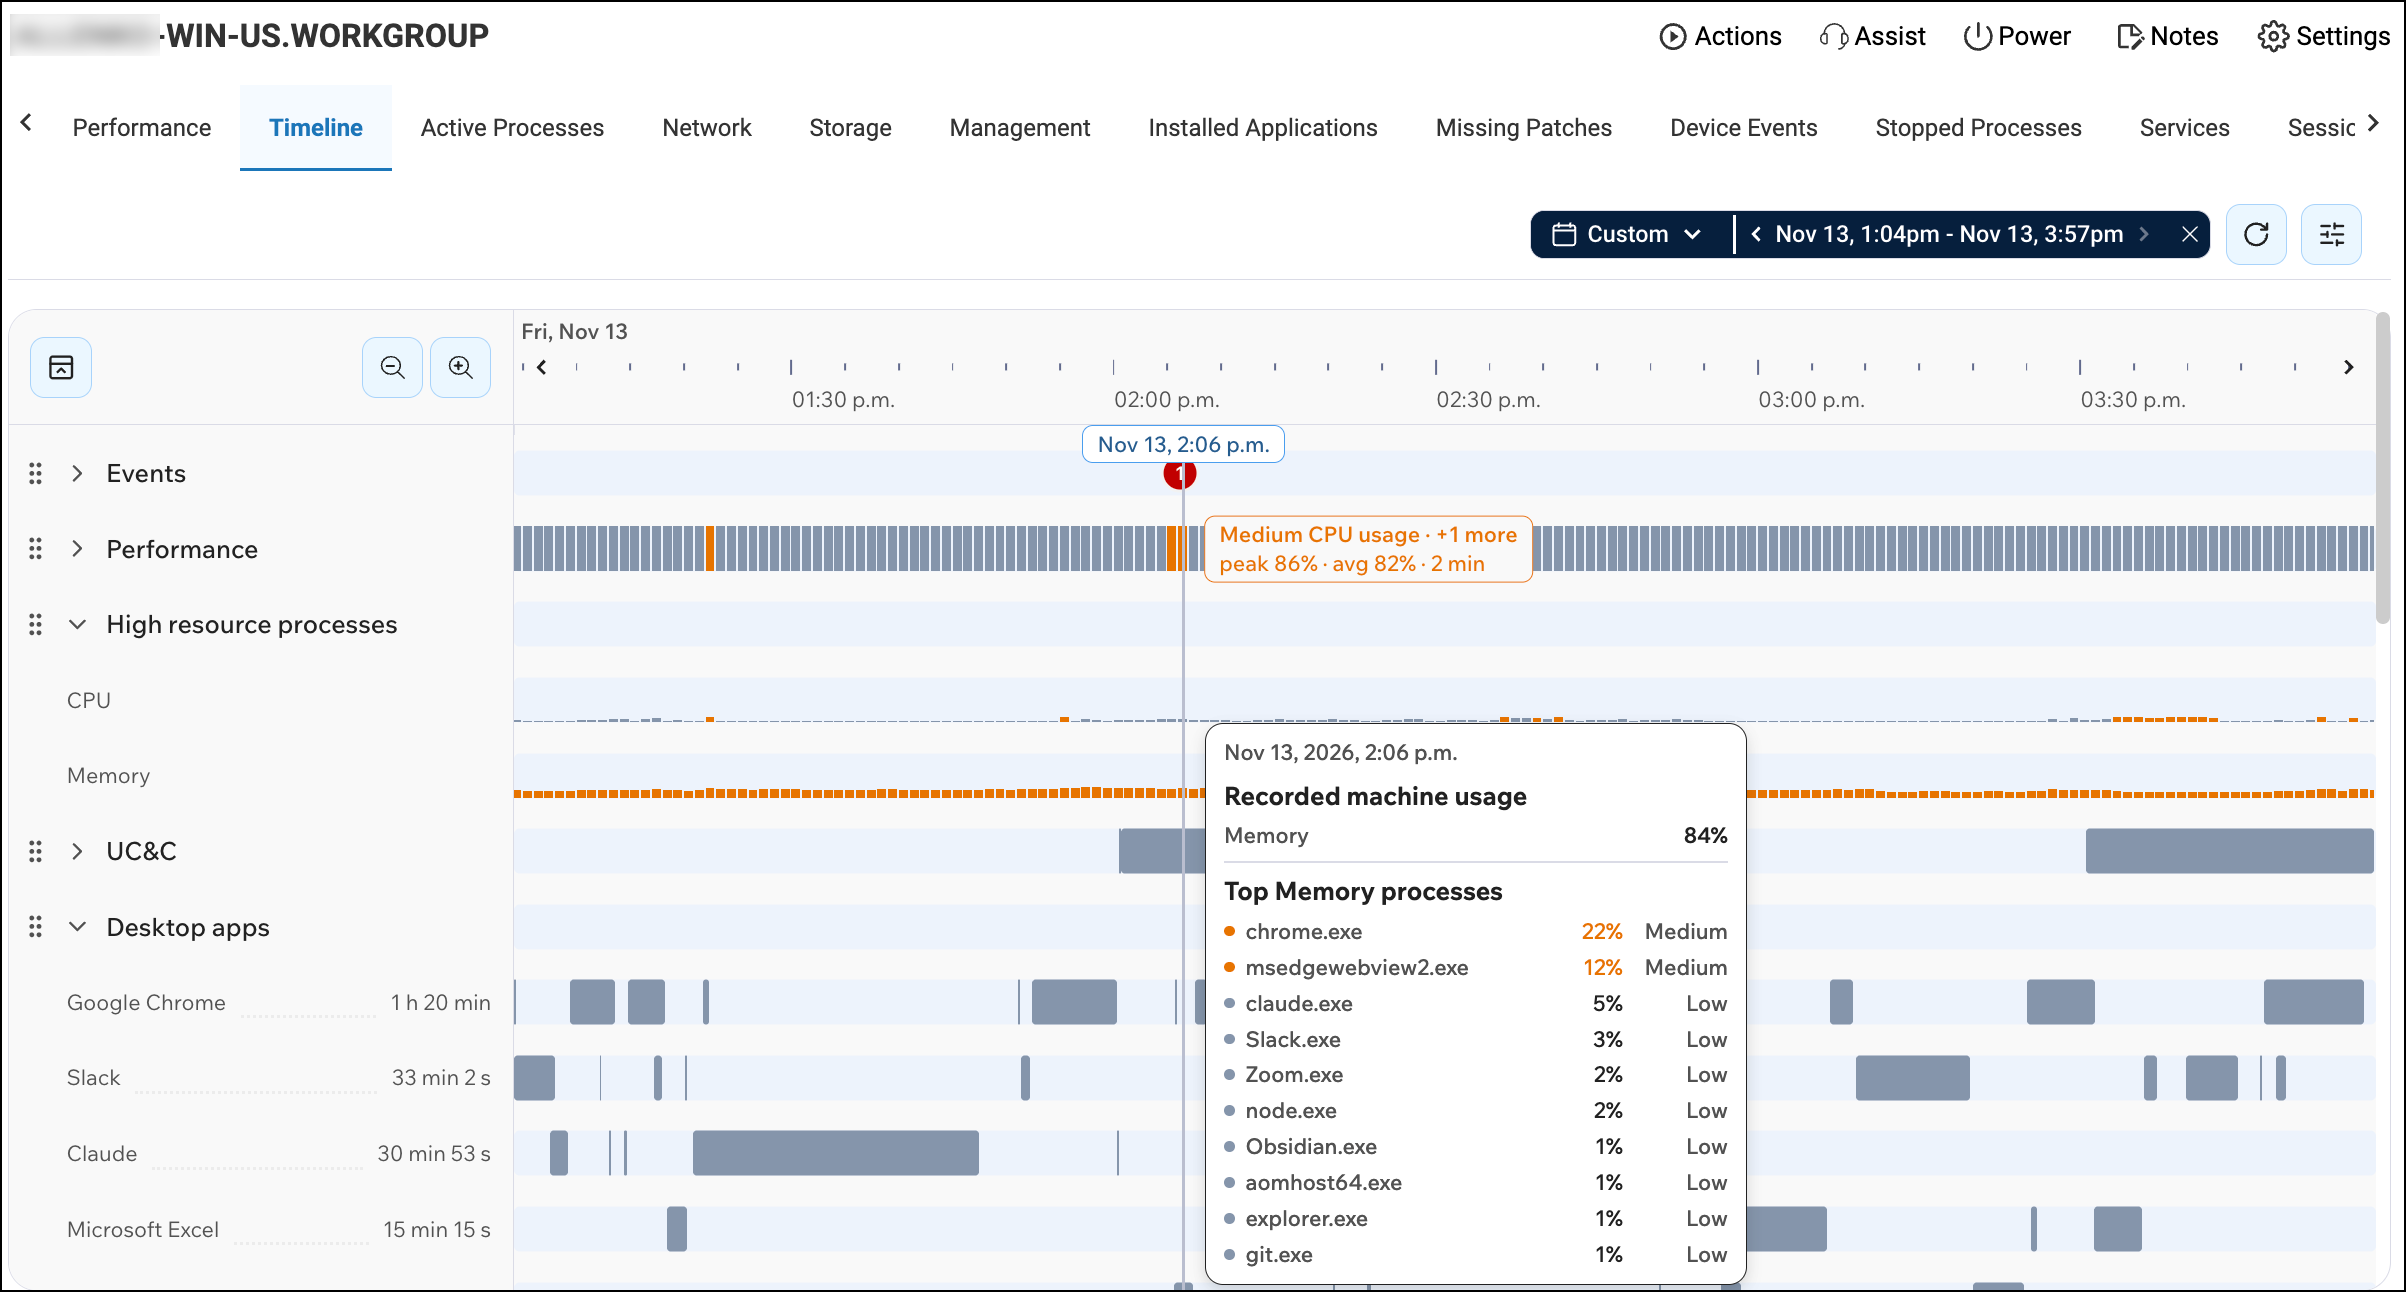
Access the timeline
- Go to Devices > Details.
- Select a device.
- Click the Timeline tab.
The Timeline opens on the Last 24 hours.
Lane groups
Some groups appear only when the device has data for them, or only when the feature is turned on for your organization.
| Group | What it shows |
|---|---|
| Events | Apps: app hangs and crashes. App hangs and foreground or windowed app crashes are shown in red. Background crashes and crashes with an unknown app state are shown in orange. System: boots, shutdowns, system crashes (BSOD), unclean restarts, resume from hibernation. Alerts: alerts raised for the device. |
| Performance | Lanes for CPU, Memory, Disk, Network, Responsiveness (input delay), Handles and Power (battery). More lanes, such as GPU usage, can be turned on in your Timeline settings. |
| High resource processes | Processes that used a lot of CPU or Memory, graded per process. The minimum usage for a process to be recorded is set in your organization's Extended Settings. |
| Connectivity | One Wi-Fi signal lane per network name (SSID), up to 12. Wired connections are not shown. |
| UC&C | Microsoft Teams and Zoom calls as bars. Hover a bar to see call quality. |
| Desktop apps | The app in focus over time, one lane per app, up to 12. Apps that aren't on your organization's business applications list appear together in one < Non-Business App > lane. |
| Session activity | When the session was Locked, Idle, Active or Disconnected. Shown only for devices with a single session. |
| Browser apps | Websites visited, one lane per domain, up to 12, plus an overflow lane. Non-business URLs show as Non-business (redacted). |
| Device activity | Remote control and Remote shell sessions, Script runs and Scheduled scripts. |
Choose a time range
- Click the time range picker in the toolbar.
- Select a preset, or pick a custom range on the calendar. You can go back up to one year.
- Click Refresh whenever you want newer data.
The Timeline doesn't update by itself. Data loads when you open the tab, change the range or click Refresh.
Zoom and pan
You can zoom in by:
- Clicking and dragging across the lanes. Depending on your personal preferences, the Timeline either zooms in right away or highlights the range so you can click Zoom.
- Clicking the Zoom in and Zoom out buttons in the top-left corner, above the lane names.
You can move the view earlier or later by:
- Clicking the arrows at the left and right ends of the ruler.
- Clicking and dragging the ruler (the time axis at the top). Drag right to bring earlier times into view.
The shortest window is 10 minutes. At that zoom level, dragging no longer zooms in further.
Place a cursor
Click anywhere on the lanes. A cursor line marks that moment, and hover cards and lane flags show the values at that time. With a cursor in place, you can keep the details for that moment on screen while you hover elsewhere to compare.
Use the keyboard
Click into the lanes, then:
| Key | Action |
|---|---|
| Left arrow / Right arrow | Move the cursor one step back or forward. |
| Shift + Left arrow / Right arrow | Extend a range selection from the cursor. |
| Esc | Clear the cursor or selection. |
View event details
- Hover over a dot or bar to see a summary card.
- Click a dot, or a remote session bar, to open the event details.
The details window shows the event's fields. Depending on the event, it can also include a crash stack, a description or script output. Script runs show a colored Result badge (success, failure, or still running).
- Copy a field or text block with its copy button.
- Click Send to AI Assistant to ask the AI Assistant about the event. This button appears only if your organization has the AI Assistant.
Stacked events
Events of the same color that happen close together show as one dot with a number on it. Hover the stack to see its five newest events. Click the stack to open the first one. Then:
- Use the < and > arrows in the details header to step through the stack.
- Type a number in the position box to jump straight to that event.
Understand stress readings
The Performance and High resource processes lanes are colored by how stressed the device is:
| Color | Severity | Meaning |
|---|---|---|
| Grey | Normal | Below the Medium threshold, or the metric isn't graded |
| Orange | Medium | Crossed the Medium threshold |
| Red | High | Crossed the High threshold |
Your admin sets the thresholds (see Configure severity thresholds below).
When a group is collapsed, its header shows the worst color in that group. Expand the group to see which lane caused the stress.
- Performance counts only the metrics included in the stress score. By default these are CPU usage, Memory usage, Disk usage and Network usage. Times when the device was offline are left blank.
- High resource processes shows the worse of the busiest CPU process and the busiest memory process.
Hover a colored stretch in a collapsed header to see what caused it, for example the worst metric, its peak and average values, and how long the stress lasted.
Network usage is a percentage of the highest throughput this device reached in the last 7 days, not of its link speed. A device that is usually quiet can show High network usage at modest speeds.
Lane flags
Lane flags are small value labels that appear on the lanes at the hover point or cursor. By default they show only Medium and High values. You can change this in Timeline settings (see below).
Customize your view (user preferences)
These preferences apply only to you. They're saved in your browser for your user and organization, so they don't follow your account to another browser or computer.
Change your Timeline settings
- Click the settings button in the toolbar.
- Under Lane behavior, set:
- Auto-zoom on drag-select: on to zoom when you drag, off to select a range instead.
- Show lane flags on: On hover and cursor (default), On hover only, On cursor only or Off.
- Show notable flags only: on (default) shows flags only for Medium and High values. Turn it off to label every value, including healthy ones.
- Under Visible lanes, select or clear groups and lanes.
- Expand a group to choose individual lanes.
- Under High resource processes, choose Processes shown: User applications (default) or All processes, including system & services. This applies to the CPU and Memory lanes, the group summary and process hover cards.
- Click Save.
These lanes are hidden by default. You can turn them on under Visible lanes:
| Group | Hidden lanes |
|---|---|
| Performance | Kernel usage, Max core usage, Processor queue, Page reads/sec, Available disk space, Disk space used (%), Disk queue length, Bytes received/sec, Bytes sent/sec, Failed connections, GPU usage (%) |
| Device activity | Scheduled scripts. Scheduled scripts can run every few minutes and add a lot of noise to the Timeline, making it easy to miss scripts that someone ran by hand. |
Groups that appear only when they have data, such as UC&C and Session activity, are listed under Visible lanes only while they're on screen.
Reorder lane groups
- Drag a group by its handle to a new position.
- Or focus the handle and press Up arrow, Down arrow, Home or End.
Your order is saved separately from your settings, and it is kept when you hide and show groups.
Collapse groups
- Click a group's chevron to collapse or expand it. A collapsed group shows one summary row with its lanes' events merged. For Performance and High resource processes, the summary row shows the stress color instead.
- Click the collapse/expand icon in the top-left corner to collapse or expand all groups at once.
Configure severity thresholds (admins)
To configure these thresholds, you must have the Configure Threshold Settings permission.
Thresholds decide which readings the Timeline colors orange (Medium) and red (High), and which metrics count toward the stress score. They apply to every user and every device in your organization.
- Open the Threshold Settings page in one of these ways:
- In the Timeline, open Timeline settings and click Open threshold settings.
- Go to Settings and select the Threshold Settings tab.
- Find the metric. Use Search metric, or turn on Show edited only to see only the metrics you changed.
- Edit the row:
- Switch: turn off to stop coloring the metric. Your numbers are kept, so you can turn it back on later.
- Medium and High: enter the values. The
>or<sign shows whether higher or lower values are worse. - Include in stress score: counts this metric toward the color of the collapsed Performance group. An excluded metric still colors its own lane. Wi-Fi signal and the process consumption rules can't be included, and show a dash instead of a checkbox.
- Click Save changes. The button shows how many rows you changed.
- To undo one row, click its reset icon. Hover the info icon to see the defaults you changed.
- To undo everything, click Reset all to default, then confirm.
- To discard unsaved edits, click Cancel.
Leave Medium or High empty to use a single level. For example, leave Medium empty to flag only High readings.