The ControlUp Stress Calculator contains multiple breaking changes that help you to adjust your Stress Settings based on the environment's performance data. You can use the Export-CUQuery PowerShell cmdlet to calculate suggested stress thresholds for most available metrics in ControlUp. Note that calculations provided by the tool are recommendations and not requirements. 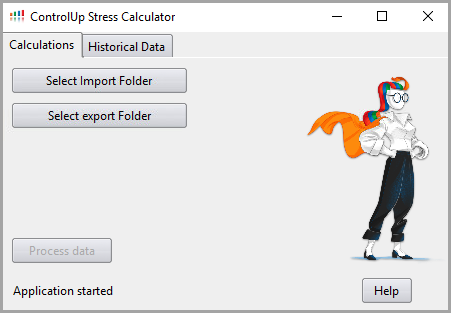
Prerequisites
At least one ControlUp Monitor installed to import the ControlUp.PowerShell.User module. Includes the Export-CUQuery Powershell cmdlet that allows you to export monitor data to a CSV file.
PowerShell version 5 or higher
Downloads
Stress Level Calculator: Download the latest version as a ZIP file:
Optional: A script action that exports your data with full configuration capabilities. You can find the ControlUp Stress Calculator v2 Metrics Exporter.xml in the ZIP file. For more information, refer to Option 2 CSV files.
Supported Data Sources for Monitor Calculations Exports
Which data you should export
You should think about your ControlUp data and decide for which metrics you want to adjust stress levels. For example, you might want to see how your Sessions Activity data performs and use the calculator to decide which stress levels would work best for that data. Or you might want to see how CPU usage or other resources perform. You can export data from:
Calculations. For data coming directly from the monitor. Best for dynamic, shorter duration data that can change during a session, where you need frequent snapshots of what's happening. For example, CPU usage or other resources.
Historical. For data that is measured once per session, such as Logon Duration or Profile Load Time. Best for data that does not dynamically change throughout the duration of a session.
The data you select to export for the tool should depend on which stress levels are most important for your organization to capture accurately.
Recommended Calculations Data
Depending on whether you need to calculate data in your environment related to hosts, user sessions, or folders, we recommend using the metrics below.
Hosts
Active memory
Consumed memory
CPU Usage %
Sessions
CPU
Memory (working and private bytes)
GPU Encoder and Decoder Utilization
GPU Frame Buffer Utilization
Non-paged Pool Memory
Memory Utilization
Pages / Sec
Virtual Disk read or write IOPS
Folders
Average CPU Usage
Average Machine Memory Utilization
Hosts CPU
Hosts Memory
Recommended Historical Data
You should export historical data that is measured once per session, such as Logon Duration or Profile Load Time. Based on whether the data is related to managed machines or user sessions, we recommend exporting the metrics below.
User Sessions Activity
Active Time %
Desktop Load Time (s)
Disconnected Time %
Group Policy Load Time (s)
Idle Time %
Logon Duration (s)
Logon Duration Others (s)
Max Latency (ms)
Profile Load Time (s)
Session Duration (s)
Session ID
Machine Statistics
CPU AVG (%)
CPU Count (#)
CPU MAX (%)
CPU MIN (%)
Disk Read Time (ms) AVG
Disk Read Time (ms) MAX
Disk Read Time (ms) MIN
Disk Transfers per sec AVG
Disk Transfers per sec MAX
Disk Transfers per sec (MIN)
Disk Write Time (ms) AVG
Disk Write Time (ms) MAX
Disk Write Time (ms) MIN
Free Space on System Drive (GB) AVG
Free Space on System Drive (GB) MAX
Free Space on System Drive (GB) MIN
Memory (GB)
Memory Utilization AVG (%)
Step 1: Generate the Data
The Stress Calculator can work with CSV files that you can create from the VDI App or from the attached Metric Exporter script.
Option 1: CSV files from VDI App
Collect the data you want to import: we can find suggestions here.
Open a VDI report in the web interface which contains data you want to analyze. Select a time range (1) and click Export > Download (2). The CSV is downloaded, containing data collected for the selected time range.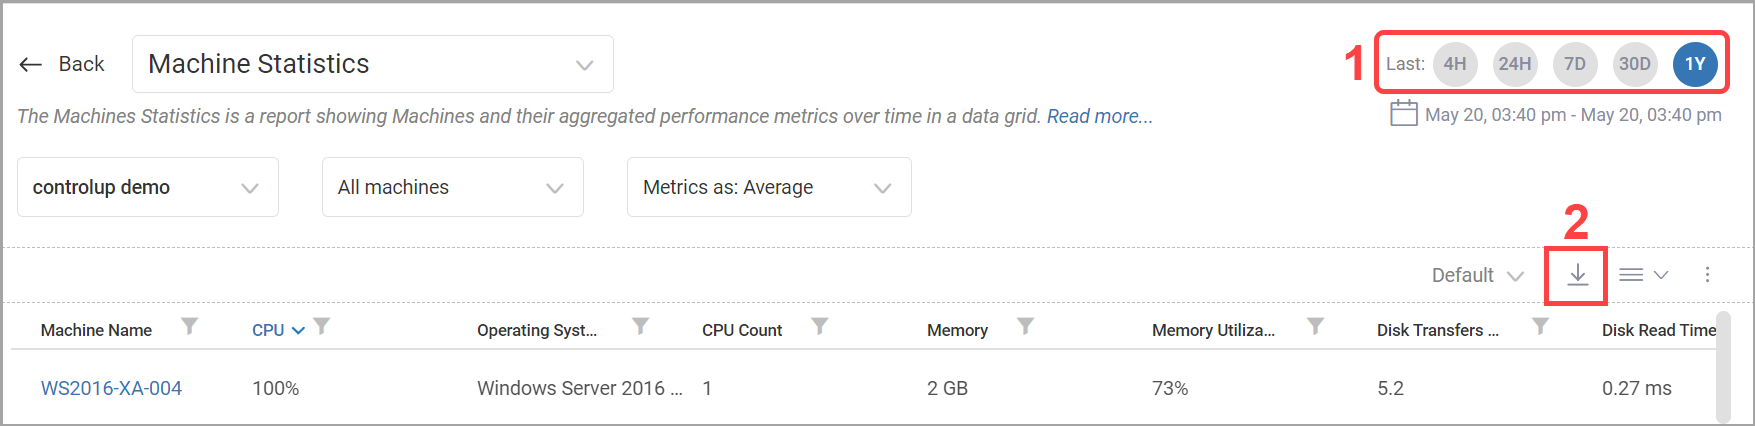
Save the CSV on the machine that runs the Stress Calculator.
Run the tool and follow the instructions.
Option 2: CSV files from SBA
We strongly recommend to use the SBA as it was optimized to export supported metrics. You can find all supported metrics at the end of this section.
Extract the ControlUp Stress Calculator v2 Metrics Exporter.xml from the Script Library to a console machine.
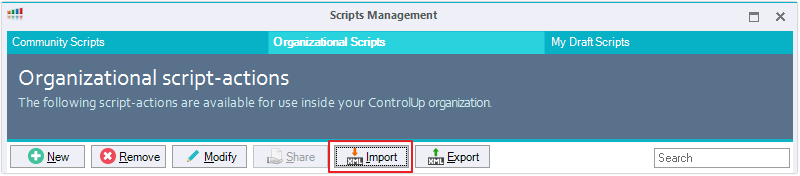
In the Real-Time Console, open Script Actions > Organizational Scripts > Import. The file dialog opens.
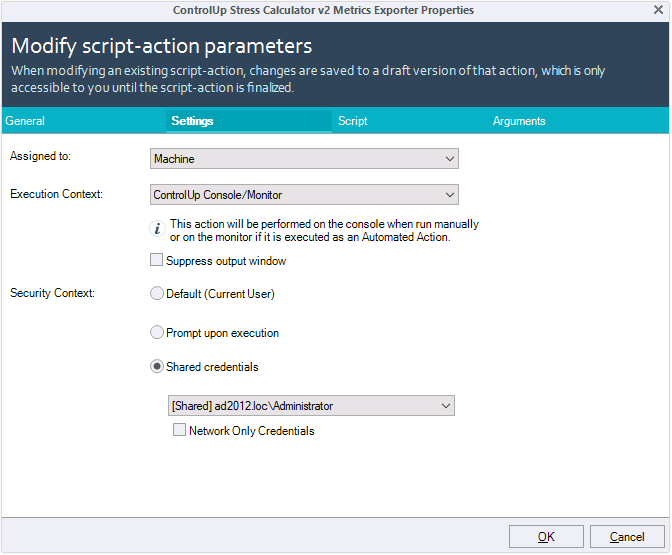
After you import the XML, double-click it to open the properties of the script. In the Settings tab, set the following values:
Execution Context: ControlUp Console/Monitor
Security Context: Shared credentials and select a user that is set up as a shared credential in the Monitors Settings.
Right-click a monitor machine > Script Actions > ControlUp Stress Calculator v2 Metrics Explorer (Draft). The properties dialog opens.

Under Export Location, set the path under which the export files should be saved. In our case, we use a local path on the monitor machine. Set the retention period for the export files under Maximum File Age and decide which data you want to export.
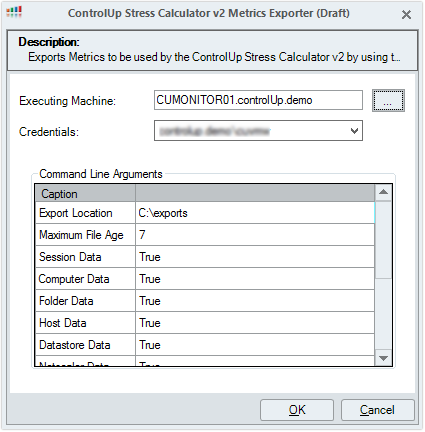
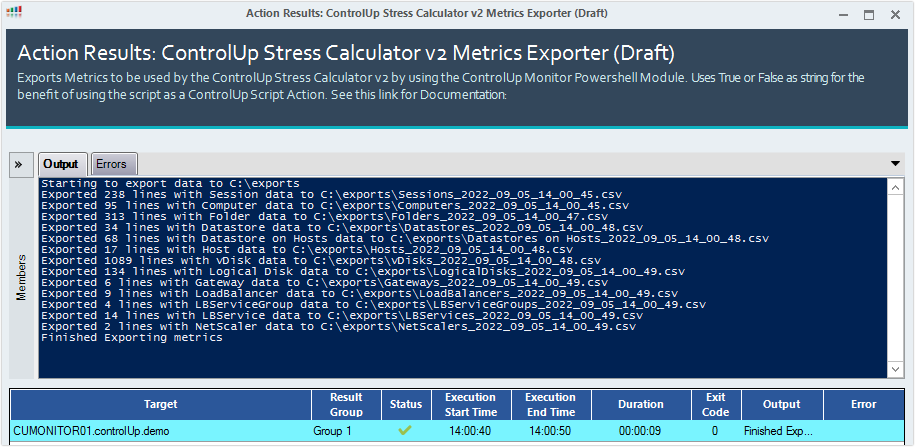
Click OK to execute the script. Information about the exported files are shown in the output window.
The next step is to create a Scheduled Trigger to automate the creation of CSV files. This is recommended as more export files mean higher accuracy for the Stress Level calculation.
So far, you have learned how to manually execute the SBA. You should use this approach if you only want to generate data once. Whenever possible, automate actions. The next section discusses Scheduled Triggers, which you should use here.
Finalize the Script and Create a Scheduled Trigger
Finalizing the imported script action is the first step before creating a Scheduled Trigger. Script action is currently in draft mode. You must finalize a script to run it based on a trigger, as only Organizational Scripts can be run this way.
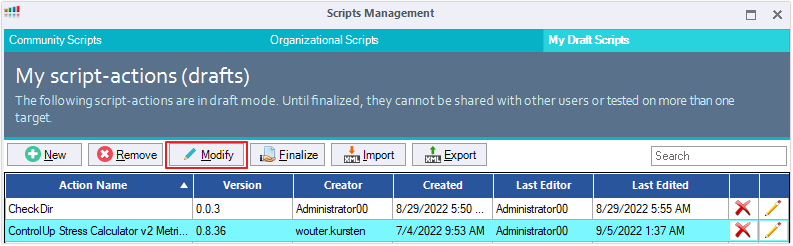
In the console, click Script Actions and open the My Draft Scripts tab.
Select the script and click Modify
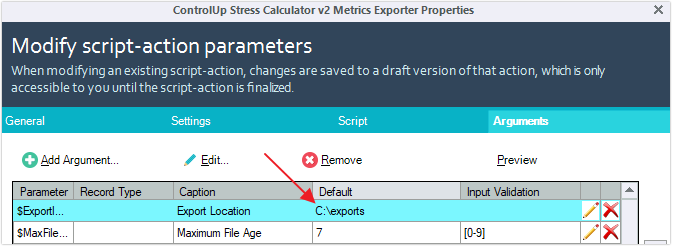
Define the export path by changing the default value. In our case, C:\exports will be used to store the CSV files.
To set up a Scheduled Trigger with the Stress Level Calculator action:
In the console, click Triggers.
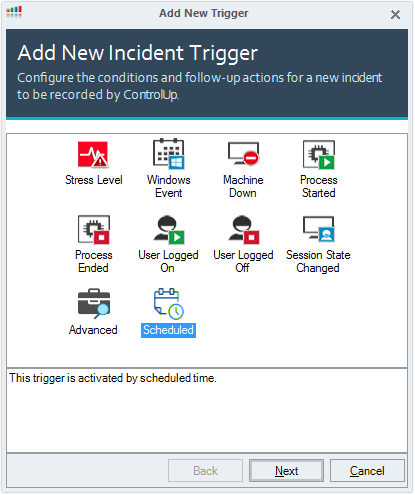
Click Add Trigger > Scheduled and click Next.
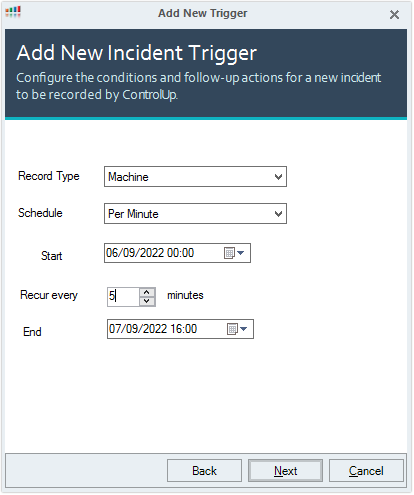
Configure the schedule for the trigger. Select Machine as we want to set a criteria filter with machine-related metrics. Set the Schedule according to your requirements. Click Next.
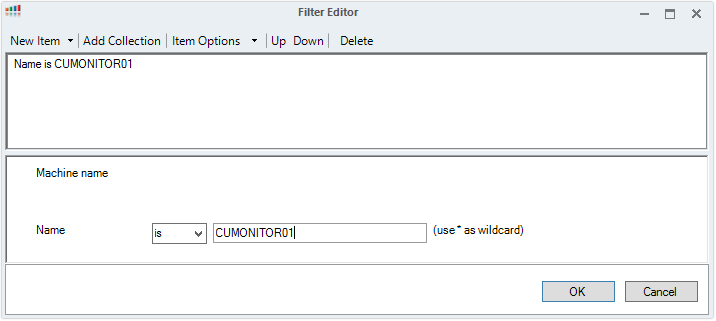
Under Filter Criteria, set a filter for running the trigger only on a specific machine. This can be any filter criteria, but for our purpose, we only want to run the trigger on a particular monitor machine, hence we use the Name metric and the hostname of the monitor machine. Click OK > Next to configure the scope.
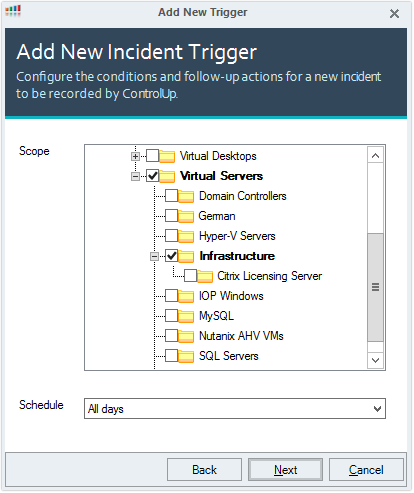
Select the scope of your organization tree. The trigger is executed only on machines that reside in the marked folders. Click Next to configure the follow-up action.
Add the script as the follow-up action and click OK and Next.
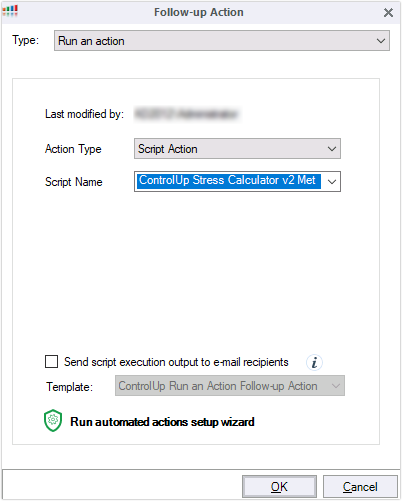
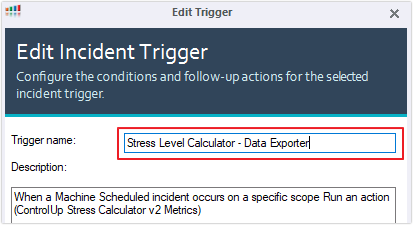
By default, the trigger is named Machine Scheduled Trigger. We recommend to make the trigger name user friendly. Once you renamed the trigger, apply the changes.
Once the scheduler is triggered, the exported files are stored in the C:\export folder on the selected monitor machine, defined in the filter criteria in Step 4.
Supported Metrics for the Script Action
You can export all of the metrics from the following script actions:
Computer Data
Datastore Data
Folder Data
GateWay Data
Host Data
LoadBalancer Data
Load Balancer Service Data
Load Balancer Service Group Data
LogicalDisk Data
Netscaler Data
Session Data
VirtualDisk Data
Step 2: Run the Stress Level Calculator
To load the executable from the extracted ZIP file, open a PowerShell window as an administrator and run the following script:
.\ControlUp Stress Settings Calculator.exe - Requires CU 8.6.5.ps1
Import and Export the Data
Once you set your arguments as described above and you click OK, you see the following tab options:
Calculations. Use this tab to calculate the values for data exported from the ControlUp Monitor.
Historical Data. Use this tab to calculate the values for CSV data exported from the web interface.
Help. Access help information for running the tool.
In the Calculations tab, click Select Import Folder, or in the Historical Data tab, click Select CSV file.
Select a CSV file to import data from.
In the Calculations tab, click Select Export Folder, or in the Historical Data tab, click Export results.
Select a target folder to export data to.
In the Calculations tab, click Process data to export data to the target folder. In the Historical Data tab, the data exports automatically.
Note
Depending on the amount of data, it might take a while to load or seem like the tool is not responding.
Error: decimal separator
If the exported .xlsx files show the error "No exportable data found...", its means that the ControlUp Monitor exporting the data has a different decimal separator from the machine running the Stress Calculator. To fix this error, run the executable with -decimal_separator ",", or with a period . instead of a comma ,.
6. After the data finishes processing, open the exported Excel files per metric type (computers, sessions, hosts).
7. For calculations data, the suggested Stress Threshold for specific metrics is displayed for both the 75th percentile (yellow) and the 90th percentile (red) in the rows of the Excel files for each folder. If the file contains no data for a metric, the value shows as N/A.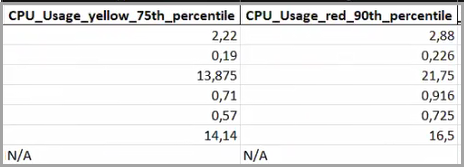
For historical data, the suggested Stress Threshold for specific metrics is displayed for both the 75th percentile (yellow) and the 90th percentile (red) in the rows of the Excel files for each metric. If the file contains no data for a metric, the value shows as empty.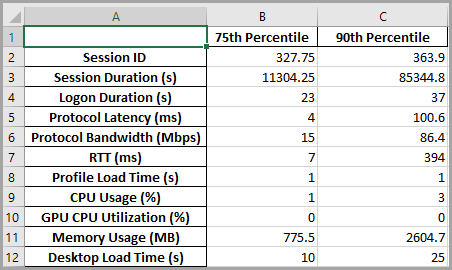
In the following section, we show how to make those changes in the Real-Time Console.
Adjust Stress Thresholds Based on the Results
In the previous section, the tool provided suggested stress thresholds in Excel files which we need to apply in our organization. This is done from the Real-Time Console. Follow the steps below to apply the suggested values:
In the console, click Settings > Stress. The Stress Level Settings window appears.
Under Folders Tree, browse the source folder that you used in the tool and select the metric.
Change the values in the Yellow and Red fields accordingly. Click Apply to save the changes.
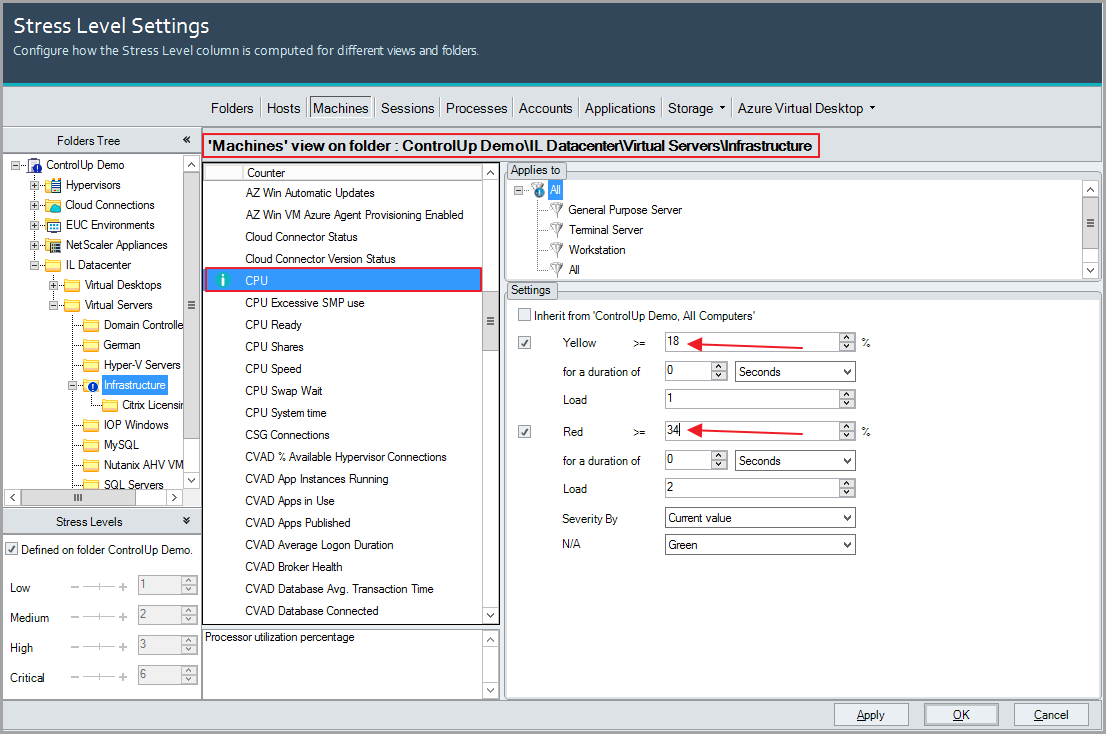
Now, the load calculation adds 1 load point for CPU utilization between 18 and 34 percent, and 2 load points for CPU utilization above 34 percent.