This article walks you through all Azure-related updates that we added to our VDI App. You can benefit from all VDI App functionalities like the Discovery view or Custom Dashboards.
To set up an Azure integration in ControlUp, see here.
Azure-Related Elements in Topology View
The VDI App topology view helps you to drill down into Azure-specific entities. In this section, we cover how you can access the following views and what information you can see in each:
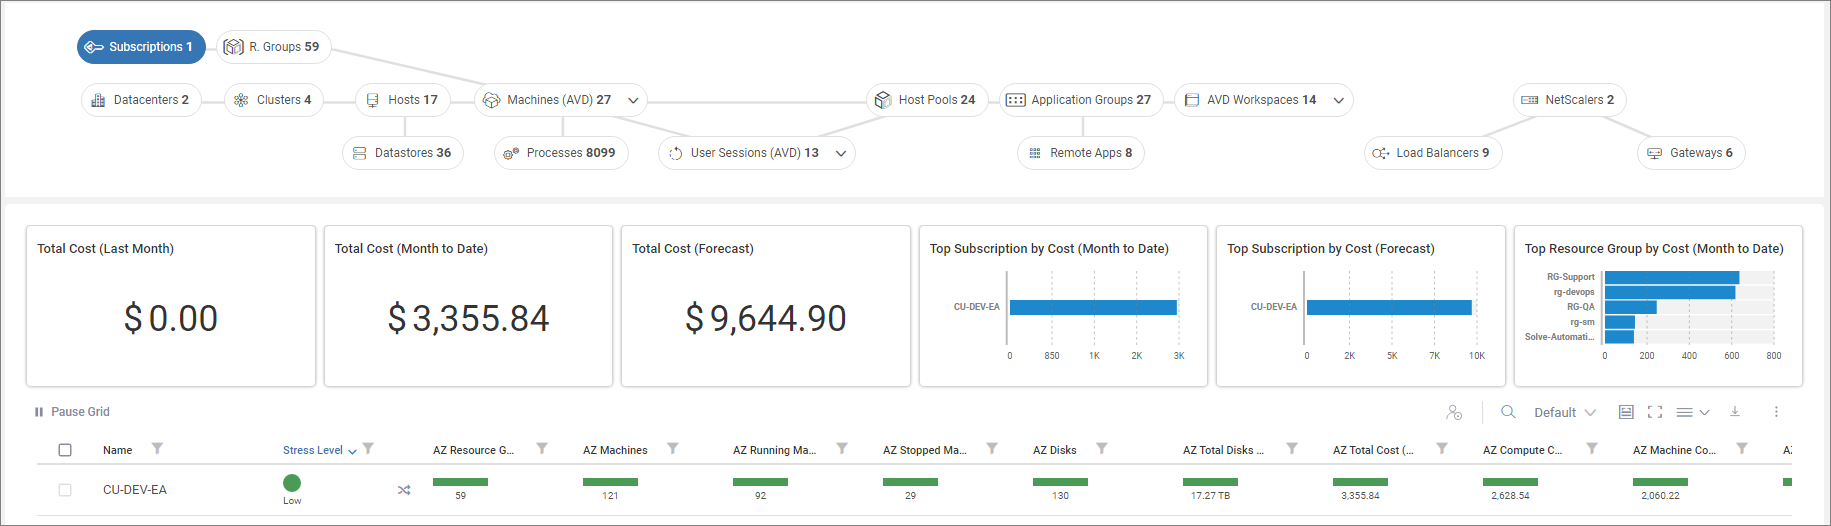
Subscriptions
Click Subscriptions to see all subscriptions that are connected to your ControlUp environment. This view dispalus details like cost widgets or Azure data.
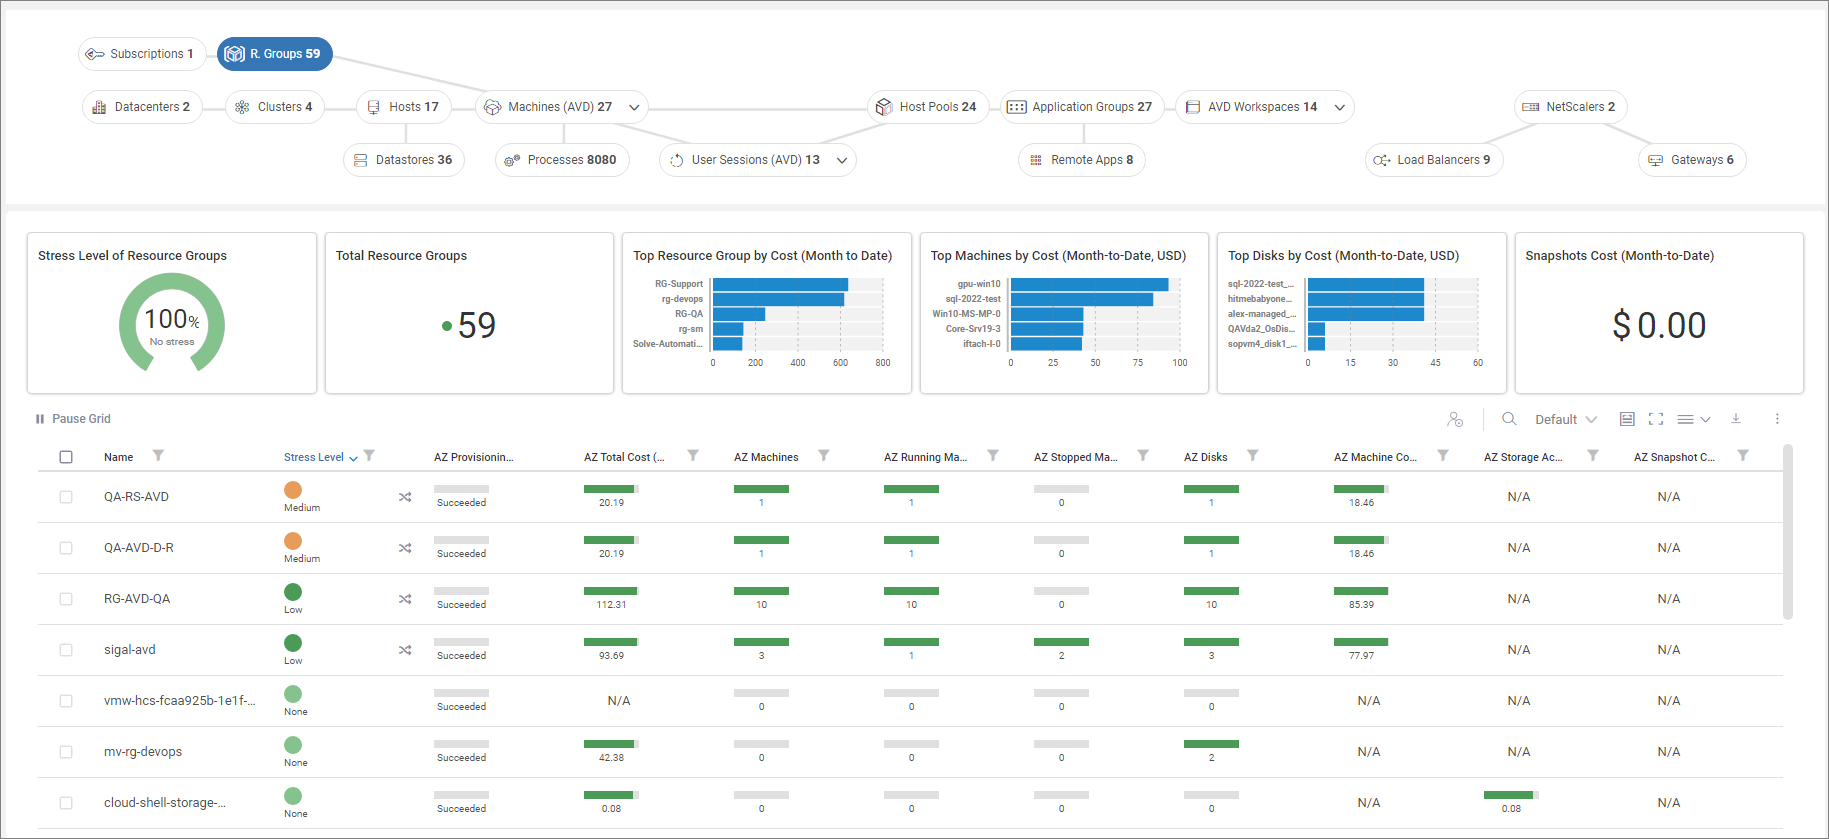
Resource Groups
Click R. Groups to navigate through all resource groups that are associated with the connected subscriptions.
Machines (Azure)
From the Machines drill down, click Machines (Azure) the view the Azure machines in your organization. The number of Azure machines shown is the total number of machines from connected subscriptions.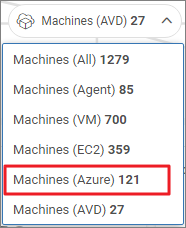
In this example, we have connected one Azure subscriptions which consists of 59 resource groups under which 121 Azure virtual machines (1). The number of virtual machines is the sum of the AZ Machines column across all connected subscriptions (2).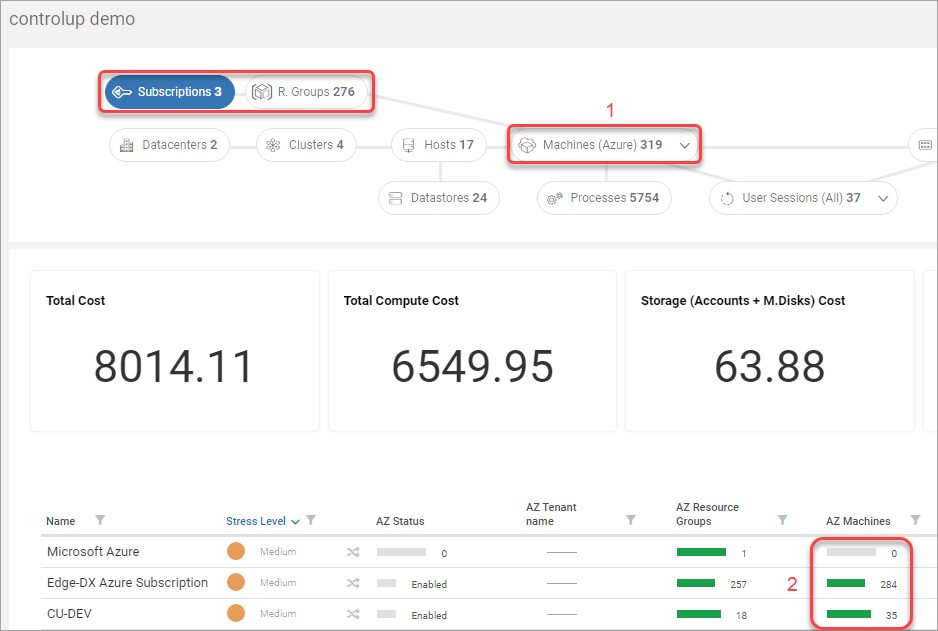
The same logic applies to the subscription drill down. If you select a subscription, then the toatl number of Azure machine is the sum of all virtual machines within the selected subscription. In our case, the Edge DX Azure Subscription consists of 284 Azure machines.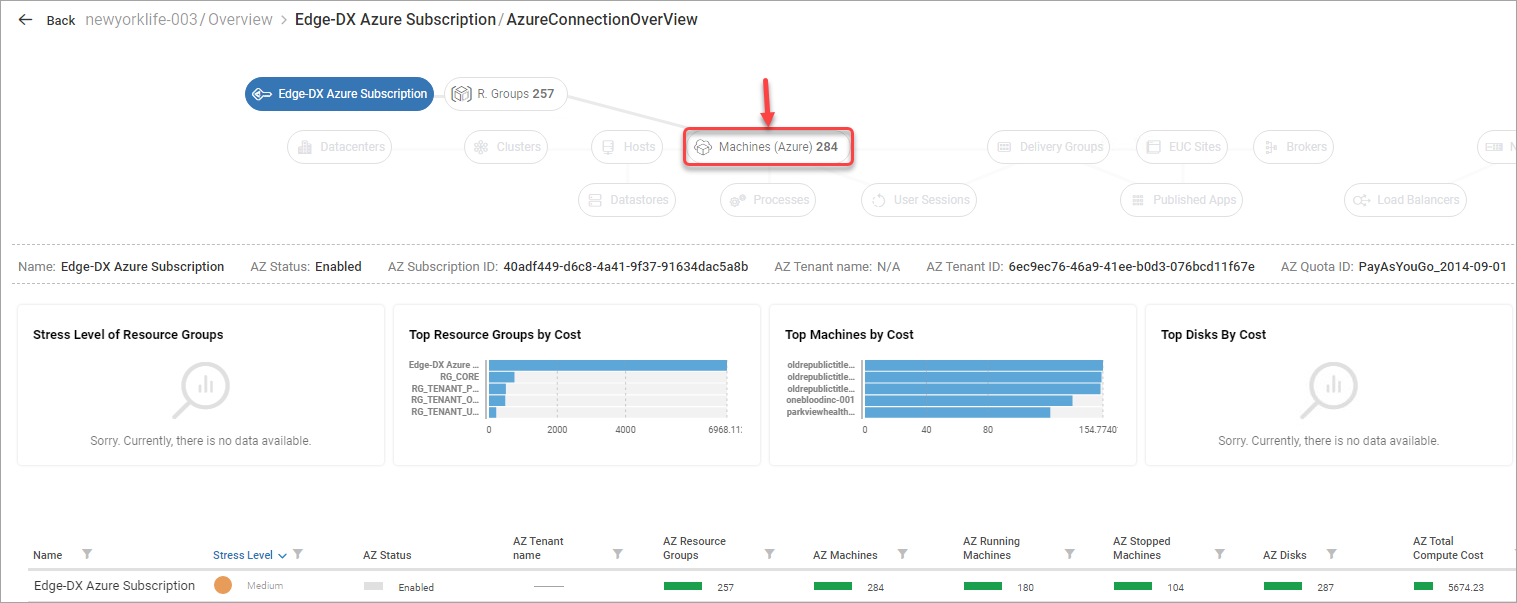
Machines (AVD)
Click Machines (AVD) to view all AVD machines that are located in the connected resource groups.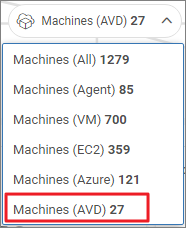
Host Pools (AVD)
Click Host Pools for an overview of all AVD host pools.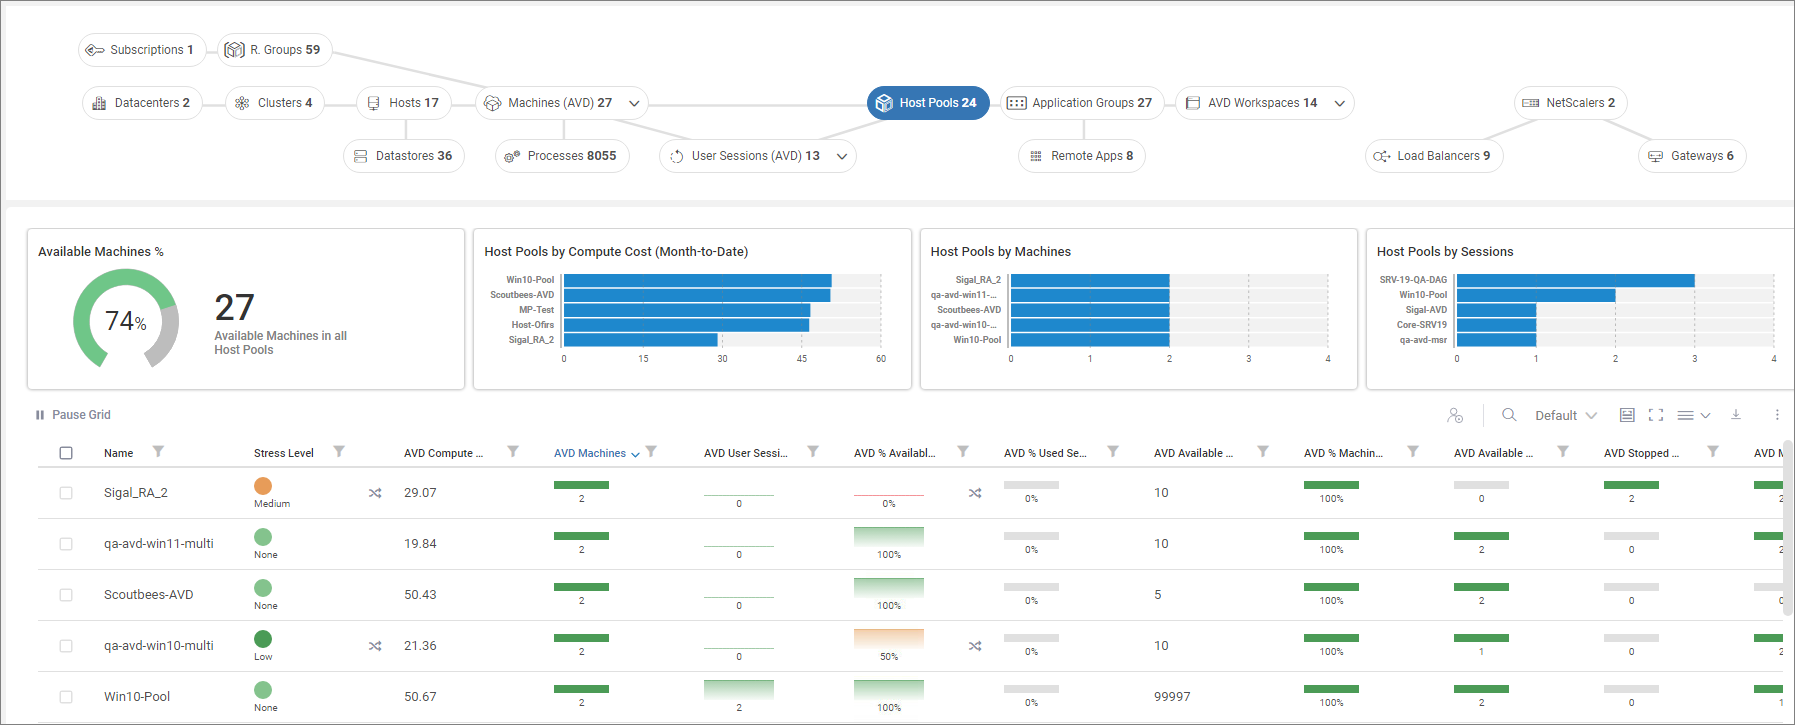
Click here to see available metrics in this view.
Virtual Disks
The VDI App can show you virtual disks associated to a specific resource group. Select a resource group in the topology tree and you will see a Disks button above the Total Cost widget.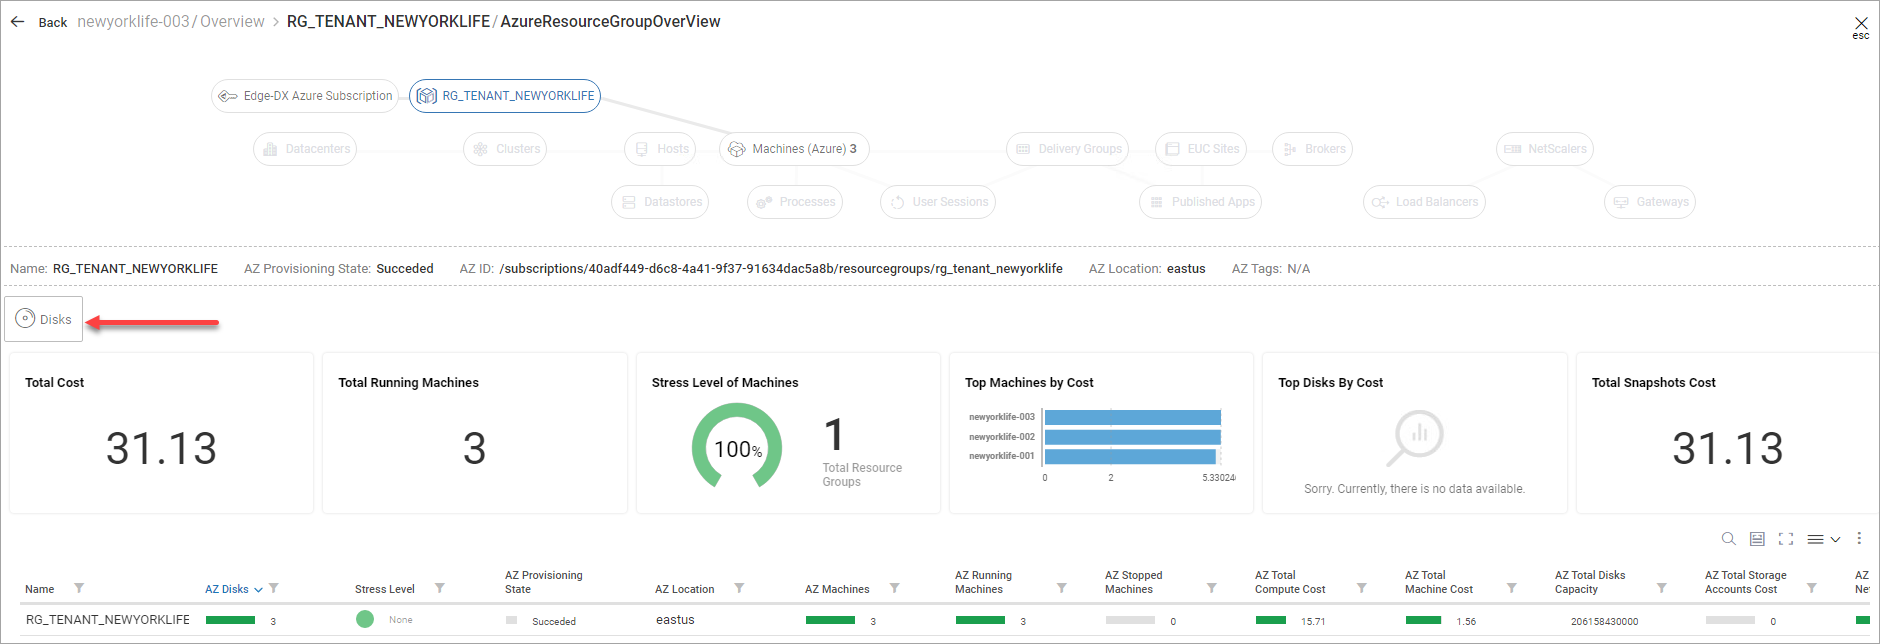
In the Disks view, you can see aggregated details of disks in the selected resource group.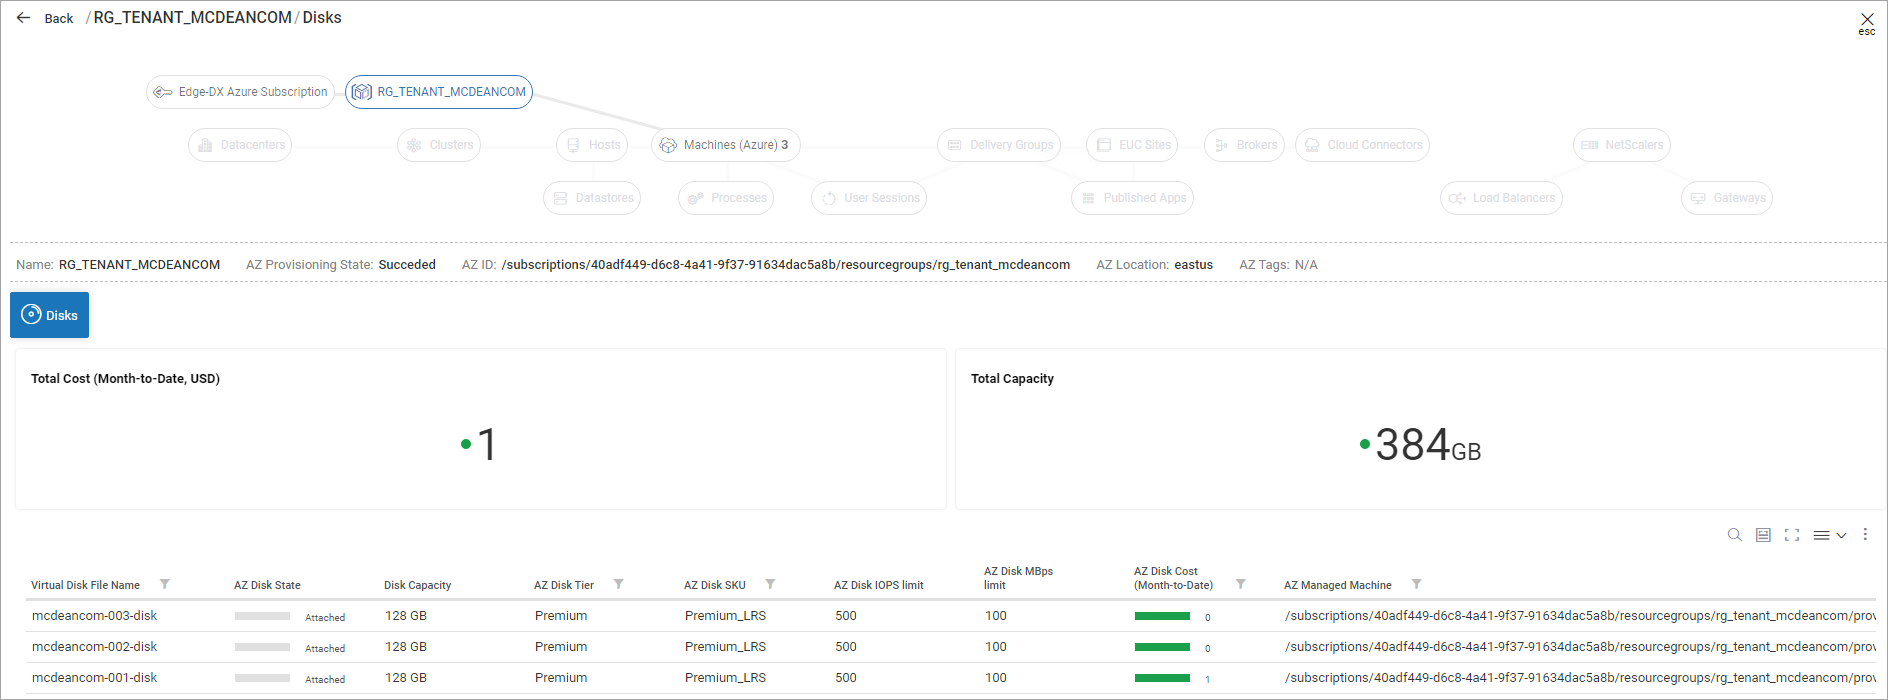
AVD Application Groups
Click Application Groups for an overview of AVD Application Groups in your organization.
AVD Workspaces
Click AVD Workspaces for an overview of AVD Workspaces in your organization.
AVD Remote Apps
Click Remote Apps to view AVD host pools using remote apps in your organization.
User Sessions (AVD)
Click User Sessions (AVD) to view all AVD user sessions in your organization.