Feature available only in version 9.2
This article describes monitor features only available in ControlUp Real-Time DX version 9.2.
Session launch failures can disrupt productivity and create urgent troubleshooting demands. The Citrix User Connection Failure Monitoring feature gives you real-time visibility into connection issues, clear failure reasons, user context, and recommended actions, all captured directly from the Citrix Cloud and Citrix Broker. With rich diagnostics and actionable insights, you can quickly identify and resolve problems, keeping your Citrix environment reliable and your users connected.
For prerequisites to use this feature, see here.
To view the metrics for Citrix User Connection Failure Monitoring in the VDI web app, you must upgrade the ControlUp Agent to version 9.2 on all Citrix DDCs/Controllers. For instructions, see here.
What It Does
Prevent user impact: Detect and diagnose session launch failures as they occur.
Accelerate troubleshooting: Access detailed failure reasons, user context, and client details.
Comprehensive failure capture: Monitors all session launch failures in real time from the Citrix Cloud and Citrix Broker.
Detailed diagnostics: Captures 27+ failure reason codes with clear descriptions, and recommended actions to resolve issues faster and reduce downtime.
Quick triage: Categorizes failures into 6 high-level categories for streamlined troubleshooting.
Supported Environments
Works seamlessly across on-premises CVAD and Citrix Cloud (DaaS) deployments:
CVAD: Retrieves failure data from Citrix Broker OData API.
Citrix Cloud: Retrieves failure data from Citrix Cloud Monitor API.
Unified incident tracking across both deployment models.
How It Works
Real-time Failure Detection
Captures all session launch failures directly from the Citrix Cloud and Citrix Broker, ensuring immediate visibility into issues impacting users.
Rich Diagnostic Data for Root Cause Analysis
When a connection failure is caused by the VDA, the Connection Failures tab displays a detailed, enriched description of the specific failure reason. This provides clear insights into VDA‑driven issues for faster and more accurate troubleshooting.
User context: UPN, username, domain, full name, SID.
Client details: Client name, IP, version, platform.
Connection path: ConnectedVia and LaunchedVia hostnames/IPs, protocol.
Machine state: Registration state, power state, fault state, maintenance mode, VDA version.
Session timing: Brokering duration, VM start, profile load, GPO processing, HDX initialization timestamps.
Citrix context: Delivery Group, hypervisor, VM name, Controller DNS.
Recommended Actions
Each failure reason includes easy-to-read descriptions and recommended remediation steps, reducing guesswork and accelerating resolution.
Trigger & Alerting Integration
Configure triggers on connection failure events using stress level or advanced filters.
Filter by any failure field (e.g., Failure Category, Client Platform, Delivery Group, User, Machine).
Execute automated actions: email notifications, webhooks, scripts, event log entries.
Metrics
Registration Failures and Connection Failures metrics display in the data grid for 1 hour. To view historical metrics for Citrix registration and connection failures, see the Citrix Connection Failures report.
Registration Failures Metrics
The Registration Failures tab includes the following metrics:
Header | Description |
|---|---|
Catalog Name | Name of the Citrix Machine Catalog to which the affected VDA belongs |
Citrix Site Name | Name of the Citrix Site to which the VDA and DDC belong |
Correlated DDC Events Count | Total number of correlated Windows events on Delivery Controller(s) for this incident |
Correlated VDA Events Count | Total number of correlated Windows events on the affected VDA for this incident |
DDC Hostname | Hostname of the DDC that the VDA was attempting to register with, or that reported issues with the VDA |
DDC Version | Product version of the DDC software that the VDA was attempting to communicate with |
Delivery Group Name | Name of the Citrix Delivery Group associated with the affected VDA |
Deregistration Reason Code | Code for VDA deregistration reason |
Hypervisor Connection Name | An identifier for the specific hypervisor the VDA is running on |
Incident End Time UTC | End time of the registration failure incident |
Incident ID | Unique identifier of the registration failure incident |
Incident Start Time UTC | Start time of the registration failure incident |
Incident Status | Current lifecycle state of the registration failure incident |
Last Update Time UTC | UTC time when this incident record was last updated |
Resolution Duration | Incident resolution duration |
Resolution Method | Incident resolution method |
Source Type | Source Type (Event Log or Citrix Cloud API) |
Stress Level | Stress Level is a flexible load measure which you can customize using the "Stress Settings" pane. |
User Session Count at Incident | Count of user sessions (active or disconnected) on VDA at failure time |
VDA Hostname | Hostname of the VDA that experienced the registration failure |
VDAID | Internal Object GUID for the VDA |
VDA in Maintenance Mode at Incident | True if VDA was in maintenance mode during registration failure |
VDA IP Address | IP address of the VDA at the time the registration failure incident was recorded |
VDA Version | Specific product version of the Citrix Virtual Delivery Agent software installed on the VDA |
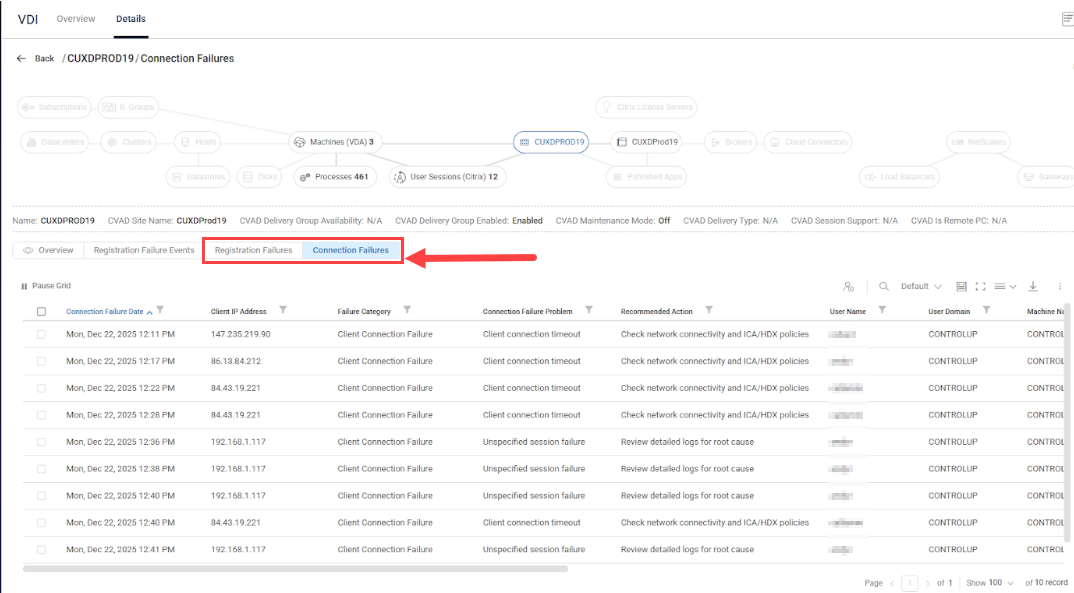
Connection Failures Metrics
The Connection Failures tab includes the following metrics.
Header | Description |
|---|---|
Connection Failure Date | Exact data and time when this connection failure occurred |
Failure Category | Broad category that classifies this connection failure type (Machine Failure, Client Connection Failure, No Capacity Available, No Licenses Available, or Configuration Issue) |
Connection Failure Problem | Description of the connection failure |
Recommended Action | Next action to take for this connection failure |
User Name | User who attempted the failed connection |
User Domain | Domain the user belongs to |
Machine Name | Name of the machine where this connection failure occurred, or null if no specific machine was involved in the failure |
Delivery Group Name | Display name of the delivery group that the failed connection attempted to access |
Connection State Description | Current connection status of this session |
Machine Registration State | Registration status of the machine at the time of the connection failure, indicating whether the machine was properly registered with the Citrix broker |
Machine Maintenance Mode | Indicates whether the machine was in maintenance mode when the connection failure occurred, which would prevent new user sessions from starting |
Current Power State Description | Machine power status at the time of the connection failure |
Fault State Description | Health status of the machine when the connection failure occurred (0 = Unknown, 1 = None/Healthy, 2 = Failed to Start, 3 = Stuck on Boot, 4 = Unregistered, 5 = Max Capacity, 6 = VM Not Found) |
Client IP Address | IP address of the user device that attempted to connect to the session |