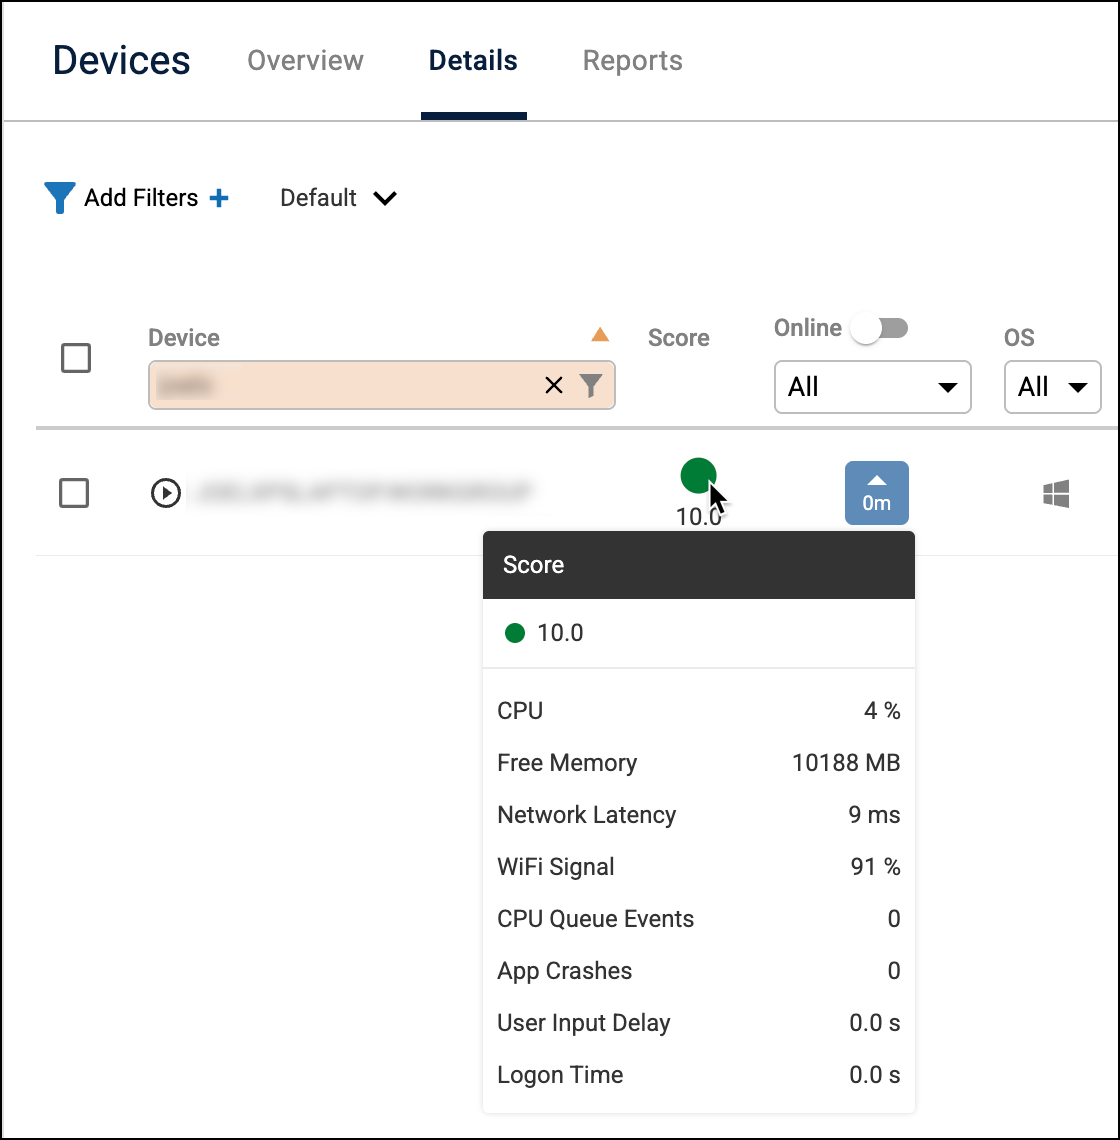
On the Devices > Details page, each device is given a score from 0-10 to give you an at-a-glance indication of the device's performance. It is calculated by first averaging key performance metrics and then subtracting points for poor user experiences.
Step 1: Calculating the base score
The score begins by grading several available performance metrics on a scale from 0 (worst) to 10 (best). All available metric scores are then averaged together to create the base performance score.
If a metric is not available or applicable to the device, it does not contribute to the average.
| Metric | Perfect Score (10) | Worst Score (0) |
|---|---|---|
| CPU Usage | ||
| Available Memory | 0 MB | |
| Network Latency | ||
| WiFi Signal | ||
| CPU Queue Length | 5 or more '0's (clear queue in history string) | No '0's (constantly busy queue in history string) |
| User Input Delay |
Step 2: Applying penalties
After the base performance score is calculated, points are deducted based on recent negative user experiences. The final score is the base score minus any applicable penalties.
| Penalty event | Scoring rule |
|---|---|
| App Crashes | Deducts 2 points from the final score for each crash recorded. |
| Slow Logon | Starts deducting points if logon takes longer than 3 seconds, with a maximum penalty of 3 points for a logon time of 30 seconds or longer. |