Feature available only in version 9.2.5
This article describes monitor features only available in ControlUp Real-Time DX version 9.2.5.
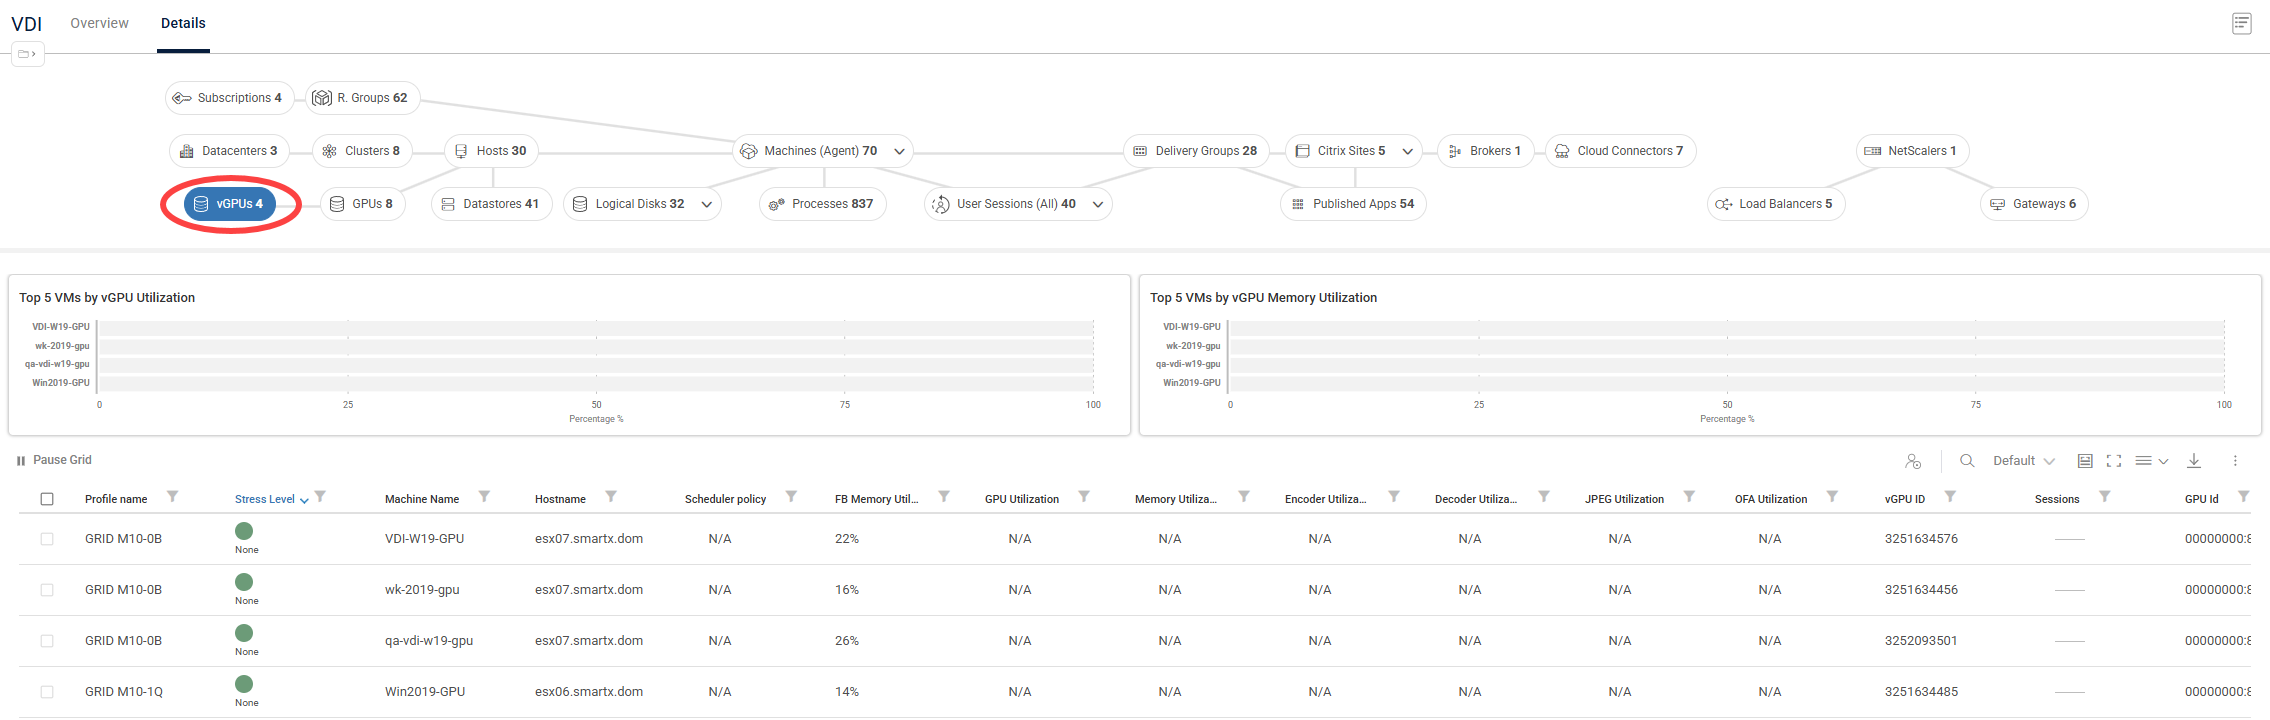
The vGPUs view provides host-level visibility into virtual GPU profiles assigned to virtual machines across your environment. This view in the Real-Time DX Console and the VDI web UI enables you to monitor compute, frame buffer memory, and specialized engine utilization per vGPU instance. By surfacing these real-time profiles, the vGPUs view helps you right-size virtual workstation allocations, troubleshoot graphics-intensive user sessions, and optimize infrastructure spend.
vGPUs metrics are displayed across the real-time topology, appearing in the dedicated vGPUs view widgets and data grid, as well as in new vGPU metrics columns on the existing Hosts and Machines views grids. You can focus on a specific host or machine in the topology view (Details) or organization tree, and drill down directly to individual user sessions utilizing vGPU resources.
You can also use vGPUs to configure Stress, Scheduled, and Advanced triggers, as well as Script-based Actions. For example, to enhance resource optimization: Detect when a high-performance vGPU profile remains completely idle during a session and automatically flag it for right-sizing.
Note
Because NVIDIA doesn’t expose vGPU metrics through standard VMware APIs, host-level data collection for this feature requires direct SSH access to your ESXi hosts.
vGPU Triggers and Actions
Virtual GPUs function as fully native targets inside ControlUp's automation and alerting engine, allowing you to transition from observation to automated optimization. Use this feature to configure:
Customized Stress Thresholds: Apply unique performance boundaries to metrics like FB Memory Utilization or Encoder Utilization. If a power-user's session caps out their profile's capabilities, their stress state updates instantly to guide troubleshooting workflows.
Advanced & Scheduled Automation: Configure automated triggers to monitor usage trends over time. Identify over-provisioned profiles that remain consistently idle to claw back expensive licensing and compute overhead.
Targeted Script-Based Actions (SBAs): Run context-aware diagnostics or management scripts directly against the selected vGPU rows to optimize settings, query deep driver telemetry, or interface with host-level graphics subsystems.
GPUs View Column Reference
The following columns are available in the Information Grid while using the vGPUs view.
Column | Description |
|---|---|
Profile name | Name of the vGPU |
Stress Level | Stress Level is a flexible load measure which you can customize using the "Stress Settings" pane |
Machine Name | Name of the virtual machine using this vGPU instance |
Hostname | The name of the host which hosts vGPUs |
Scheduler policy | Scheduler policy of the parent physical GPU, shown for convenience on the vGPU record |
FB Memory Utilization | Framebuffer usage as a percentage of the vGPU's total framebuffer |
GPU Utilization | Percent of GPU core usage for this vGPU instance |
Memory Utilization | Percent of memory bandwidth usage for this vGPU instance |
Encoder Utilization | NVENC utilization for this vGPU instance |
Decoder Utilization | NVDEC utilization for this vGPU instance |
JPEG Utilization | JPEG engine utilization (if available) for this vGPU instance |
OFA Utilization | Optical Flow Accelerator utilization (if available) for this vGPU instance |
vGPU ID | Identifier of the vGPU |
Sessions | Total number of sessions on the virtual machine using this vGPU instance |
GPU Id | Identifier of the GPU this vGPU belongs to |
Bus Id | PCI bus ID of the GPU this vGPU belongs to |
Encoder active session | Number of active NVENC sessions for this vGPU instance |
Encoder Avg FPS | Average frames per second encoded on this vGPU instance |
Encoder Avg Latency | Average encoding latency in milliseconds for this vGPU instance |
FB Free Memory | Framebuffer memory currently free for this vGPU instance (MiB) |
FB Total Memory | Total framebuffer memory assigned to this vGPU instance (MiB) |
FB Used Memory | Framebuffer memory currently used by this vGPU instance (MiB) |
FBC Active sessions | Number of active Frame Buffer Capture sessions for this vGPU instance |
FBC Avg FPS | Average frame capture rate (frames/sec) on this vGPU instance |
FBC Avg Latency | Average capture latency in milliseconds for this vGPU instance. |
GPU Index | Zero-based index of the GPU this vGPU belongs to |
Type ID | Numeric identifier of the vGPU type/profile assigned to this vGPU instance |
vGPU UUID | Unique identifier (UUID) of the vGPU instance |
VM ID | Identifier of the virtual machine using this vGPU instance |