The ControlUp Tester is a diagnostic tool that helps you validate your environment before and after deploying ControlUp products. It includes a network connectivity tester as well as dedicated testing tabs for ControlUp for Desktops (CU4D), ControlUp for VDI (CU4V), and ControlUp for Applications (CU4A).
Use the tester to identify networking issues, validate product configurations, inspect logs, and troubleshoot connectivity problems across your ControlUp deployment.
Prerequisites
- Run the tester from the correct machine for the product you are testing (see Download and run the tester).
- Review the networking requirements for your region before running network tests:
Download and run the tester
Current version: 5.0
Run the tester from the appropriate machine based on what you want to test:
- ControlUp for VDI - Run the tester from your machines running your Monitors and the Real-Time Console application. If you are using Agent outbound communication, also run the tester from your Agent machines.
- ControlUp for Desktops/Applications/Compliance - Run the tester from machines where the Desktops/Compliance Agents or Applications module are deployed.
- Synthetic Monitoring - Run the tester from machines where Custom Hives will be installed.
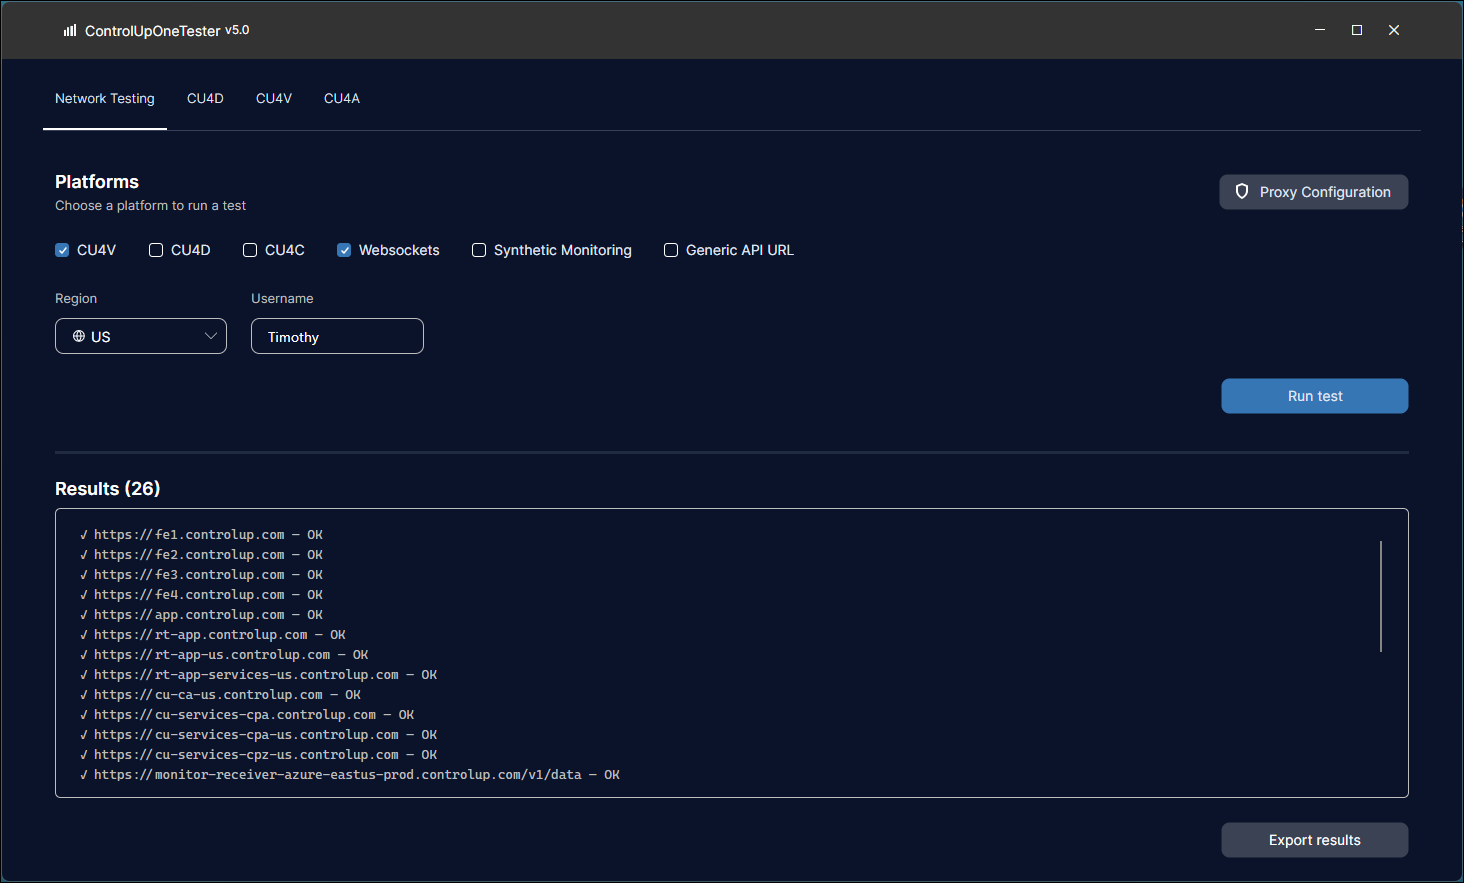
Network Testing tab
The Network Testing tab checks that your machines can reach the URLs and endpoints required by each ControlUp product. If connectivity fails, the tester identifies the reason for the failure.
Run a network test
- Open
ControlUpTester.exeand go to the Network Testing tab. - Under Platforms, select one or more tests to run:
-
CU4V — Tests required URLs for ControlUp for VDI. When testing network connections from a Monitor machine, you must run the tester under the Network Service account. Check the Username field in the tester to confirm that the tester is runnning as Network Service. If not, read Run the tester as Network Service below.
-
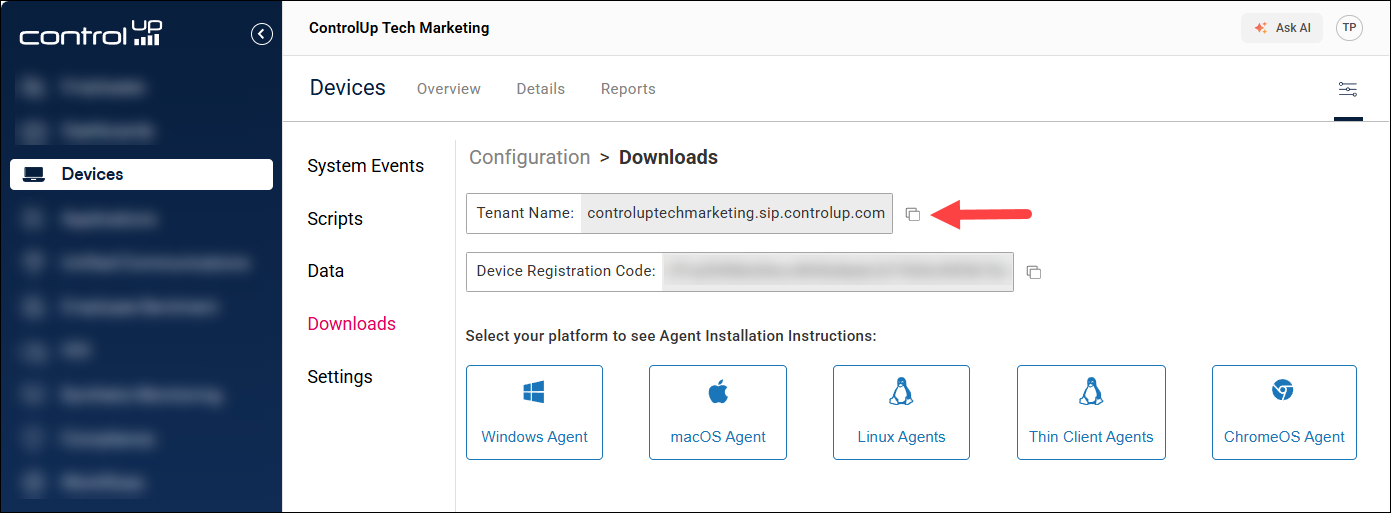
CU4D — Tests required URLs for ControlUp for Desktops. When you run this test, you must enter your ControlUp tenant URL. You can copy this from Devices > Configuration > Downloads.
-
CU4C — Tests required URLs for ControlUp for Compliance.
-
Websockets — Tests required websocket connections for ControlUp for VDI and Synthetic Monitoring.
-
Synthetic Monitoring — Tests required URLs for ControlUp Synthetic Monitoring.
-
Generic API URL — Tests a custom API URL. Use this to verify connectivity to external endpoints such as a Citrix delivery controller OData API.
- Select the Region for your ControlUp organization.
- If you use a proxy, click Proxy Configuration and enter your proxy details.
- Click Run Test and review the results.
If a URL test fails, it might not necessarily indicate a problem. Depending on your environment, particularly with VDI, not all URLs are necessary. Review our network prerequisites to see the purpose for each URL.
Run the tester under the Network Service account
The ControlUp Monitor runs under the Network Service account. If you are running the tester from a Monitor, you can run it as "Network Service" to exactly simulate Monitor communication.
To run the tester under the network service account:
- Copy the tester into the Temp folder. Note that the Temp folder path will be added to PATH SYTEM environment variables.
- Open PowerShell elevated with administrative privileges.
- Run the script
RunAsNetworkService.ps1in the ControlUpTester file. To confirm that it is working correctly, the Username field in the tester should now display "NETWORK SERVICE".
If you didn't move the tester to the Temp folder before running the PowerShell script and the tester fails to run, you must manually clean the environment variable path of the folder where the PowerShell script ran.
Tabs for specific product troubleshooting
CU4D tab
The CU4D tab provides diagnostic tests specific to ControlUp for Desktops.
- Location Detection - Device geolocation is determined using various methods. Run this test if your device location isn't being displayed as expected. The results explain how the location is determined and why your device appears where it does.
- App Focus Monitor - A user's active application usage information is stored in the
app_focusdata index and is displayed in various dashboards. When you run this test, the results display a live feed of the app focus details. You can open different apps to verify that active application information is being recorded as expected. Before you run the test, you can set the minimum time spent on an application before it is classified as the active application. For example, 5000ms means that an application is considered active only after you have been using it for at least 5 seconds. - Remote Control - If you are having Remote Control connection issues, run this test from both the Client (remote user being controlled) and the Agent (administrator controlling the session) machines. You must enter your ControlUp tenant URL and a ControlUp API key. The test uses an API endpoint to troubleshoot the websocket connections used for Remote Control.
CU4V tab
The CU4V tab provides diagnostic tests specific to ControlUp for VDI.
- LDAP Validation - This test validates Active Directory credentials with LDAP. This is useful if you experience Console login failures that appear to be ControlUp issues but are actually caused by domain controller connectivity problems.
- WSS Pulse - This test troubleshoots issues with VDI data appearing in the VDI web console. You can run this test and leave it running for a period of time such as 24 hours. It periodically pings wss:mp.controlup.com to verify that the connection is stable. If the connection is stable, it means that VDI web console problems are caused by another issue.
CU4A tab
The CU4A tab provides diagnostic and configuration tools for ControlUp for Applications. It is intended to be run from machines where the CU4A module is installed.
System info
The System Info sub-tab displays current information about the CU4A components installed on the device, including device groups, tags, and process status. The Process Status section shows whether the CU4A process is currently running and supports auto-refresh so you can monitor status in real time.
Configuration
The Configuration sub-tab displays the current JSON configuration that has been pushed from your ControlUp organization to the device. Use this to confirm that changes made in the Applications settings page in the ControlUp UI have been successfully applied to the device.
Log Viewer
The Log Viewer sub-tab automatically detects relevant CU4A log files on the device. You can also search for a specific log file manually. From this tab, you can:
- Export log files for offline review or to share with support.
- Analyze with AI to automatically review the logs against known-good baselines and identify likely issues with Claude. Before using AI analysis, click AI settings (top-right corner of the CU4A tab) and enter your Claude API key.
Extension Debugger
The Extension Debugger sub-tab validates the connection between the CU4A browser extension and the Applications module installed on the device. Use this to troubleshoot issues with the extension's websocket connection to the local Applications module.
To use the Extension Debugger:
- Select your browser.
- Optionally, enable Fresh Profile if you want to launch the browser with a clean profile.
- Click Launch debug mode.
When you launch debug mode, existing browser sessions will be closed. Make sure to save your work.
- In the Target field, select the correct browser extension from the list. Extensions are identified by ID:
- Chrome extension ID:
fbmmpaeakganhhofacjdciocgnbclbcl(when installed from CDN) orinoojfkadjhokmpdpednfbokjdangaep(when installed from web store). - Edge extension ID:
jmnkfnngldhhdkggfgemlkckmphhnojp(when installed from CDN) ordhinjceeijmmnbppipomdhbcpcjndlip(when installed from web store).
- Chrome extension ID:
- Click Connect.
- Review the logs displayed in the panel. Use the filter options to search the console logs.
- Optionally, click Analyze with AI to analyze the extension logs in the same way as the Log Viewer tab.
CDN Install Analysis
The CDN Install Analysis sub-tab helps you diagnose CU4A installation failures. It checks CU4D logs to verify each step of the installation process made by the CU4D(Sip Agent) process and identify where the install process is failing.
Use this test if:
- CU4A is not installing correctly after you have set up the configuration in the ControlUp UI.
- The System Info or Configuration tabs show no data, suggesting the installation did not complete.
Read Agent debugging logs for more information about CU4D logs.