The ControlUp Monitor is a windows service that you install on a Windows Server machine dedicated for running the monitor. The monitor is responsible for continuous monitoring of your virtual environment. The specific number of monitors that you need to deploy in ControlUp varies according to the size of the environment that you need to monitor and manage.
You can use the monitor to:
Set up automated actions to remediate issues as soon as they appear.
Analyze historical data in your environment with the VDI App.
Monitor and manage your environment with the VDI App.
Monitor Features
Running a ControlUp Monitor offers the following features to enable the continuous monitoring of your environment:
Monitoring external resources. A continuous process which doesn't require the ControlUp Console to run. Multiple monitor instances automatically provide mutual cluster, load balancing, backup, and high availability for monitoring.
Incident alerts. You can configure monitors to alert ControlUp users about incidents that can't be detected by the console. For example, only the monitor records Computer Down incidents, since detection of them requires continuous monitoring.
Retrieving data from data collectors. The monitor connects to each data collector in your organization at frequent intervals to gather detailed real-time information about the status of each data source. For more information about data collectors, see ControlUp Data Collector.
Aggregating collected data. The monitor organizes collected data from different sources that relate to the same entities in order to upload the data to the web interface. Similar to the Real-Time DX Console where data is displayed in the grid, the monitor caches the data locally on the monitor machine.
Processing aggregated data. The monitor analyzes the aggregated data in order to identify resources under stress and incidents that should trigger notifications or other automated actions. It then activates the relevant triggers and sends the aggregated data, and the information it extracted from that data about stress levels and detected incidents, to all open consoles.
Uploading collected data to VDI App. If your organization uses our VDI App to store and analyze historical data, the monitor uploads the aggregated data to our cloud-hosted VDI platform.
Using Shared Credentials. From version 9.1, you can optionally remove the Shared Credentials for "All" monitor sites and instead copy credentials to specific sites to enable Independent Sites mode.
For versions lower than 9.1, the monitor allows you to set a Shared Credential to login to configured hypervisors, virtual desktop infrastructures (VDI), cloud, or Citrix ADC connections.Automated Actions. The monitor executes automation features by running Automated Actions. Automated Actions (AAs) are scripts that you configure to run automatically as follow-up actions of triggers. Use AAs to remediate issues as soon as they appear.
Monitor Templates. Templates define default configurations for the infrastructure components that monitors receive data from, such as servers and applications. Assigning templates to monitors enables you to quickly and efficiently configure monitors for different types of resources or services, ensuring consistent oversight of system health and performance. To update monitor templates with PowerShell cmdlets, see here.
How many Monitors should you Deploy in your Organization?
Small or medium organizations with less than the maximum supported capacity per a single monitor node (e.g. less than 400,000 processes organization-wide) of managed machines and other resources typically require only one monitor. This type of deployment is especially useful if all of the managed resources are at the same location. In such organizations, a second monitor can be deployed to serve as a backup for the primary monitor and to ensure high availability.
Large organizations, or those with multiple data centers in different regions, must deploy additional monitors. We recommend to deploy about one monitor node up to the maximum supported volume of 400,000 processes, with an additional node per site for backup and high availability.
To learn more about the Monitor Deployment, watch our video.
Version Compatibility
For the best stability and performance, ensure that all ControlUp Monitor nodes in your environment are running the same Monitor version. This applies whether you use Independent Sites mode or the traditional monitor configuration.
Monitor Cluster
To support a large organization, you can use the Monitor Cluster feature to enable multiple ControlUp Monitors to work together to monitor a single organization.
Large organizations with more than 5,000 monitored resources or multiple sites require multiple monitors, with at least one monitor deployed at each site. You can add as many monitors to your organization as necessary, and they will be automatically configured to work together as a cluster.
For more information about deploying multiple monitors, see ControlUp Monitor Clusters.
Sizing Guidelines
Before you install a monitor, choose a physical or virtual machine that is correctly sized for your organization's needs and the size of your environment. Make sure the machine you choose is dedicated to only running the ControlUp Monitor service and that you have RPC access to the machine.
To view sizing recommendations for your monitor, see Sizing Guidelines.
Installing the Monitor
After you verify the prerequisites of the monitor machine, users with the Manage Monitor permission can install a monitor from the Real-Time Console. You use the ControlUp Monitor Installation Wizard to guide yourself through the process to install and configure the monitor instance. Use the wizard to select a machine from one of your managed domains to serve as your monitor machine.
After you install the service, ControlUp opens the Sites and Monitors - Configuration Wizard that collects all the required information to configure and start the monitor service.
Monitor Communication
From version 9.1, if you use the Independent Sites configuration, monitors communicate outbound on TCP port 443. You are no longer required to open TCP port 40706 to communicate inbound with monitors that are accessed from outside their assigned monitor site.
For versions below 9.1, by default, the monitor service listens inbound on TCP port 40706. You can customize monitor inbound connections in the ControlUp Monitor Installation Wizard. After you verify the prerequisites, all the files required for the installation are copied to the selected machine and a ControlUp Monitor Windows service appears.
Domain Identity
If you use ControlUp Monitors in a version before 9.0, or an On-premises environment, see Domain Identity.
Service Account Credentials
The monitor service requires valid credentials to establish connections with all of your managed machines. It is also responsible for deploying ControlUp Agents to the managed machines, in case they have no agent installed. By default, the ControlUp Monitor service is configured to start using the Network Service account, which is not sufficient for administrative connections to your managed machines. In addition, if your organization includes several Active Directory domains, the monitor requires valid administrative credentials to access all these domains.
We recommend that you create a dedicated service account for the monitor in each of your Active Directory domains. This account requires:
Allow Log on as a Service permission, and for full functionality, should have the Allow log on locally permission (and not the Deny log on locally permission). You should set this permission on all machines running the monitor service under Windows Group Policy Management Settings in Local Policies/User Rights Assignment.
The Allow log on locally option is needed for the following tasks that require impersonation (local logon) when writing to the disk (local or remote):To deploy agents to machines if the Deploy agents automatically option is selected in Agent Deployment Settings. This is because the monitor acts as a UI-less console when deploying agents automatically. From version 9.0, the Deploy agents automatically option doesn't apply to monitors. If you select this option, the console still automatically deploys the agents.
For on-prem environments to write activity files to the disk.
If you are sure that you won't use any of these features and prefer not to allow log on locally, you can assign Allow Log on as a Service. If you aren't sure, set as recommended or contact ControlUp Support.
Local administrator permissions on all managed machines. Required only if your monitor is expected to deploy agents to systems.
Modify permissions on the directory to schedule data exports. For more details, see below.
Shared Credentials Store. ControlUp allows managing credentials centrally so all authorized users can use shared credentials sets. This enables for more streamlined management of credentials, and a quicker onboarding process for new users that doesn't require them to know the service usernames and passwords.
Note that the Shared Credentials permission is set by the roles in the Security Policy Panel.
Note
Local Admins and Organization Members roles aren't allowed to manage the Shared Credentials store, you must create a new role.
The bottom of the Domain Identity page hosts the credentials saved with the monitor instance in order to enable it to connect to your virtualization infrastructure. To monitor virtualization hosts, ControlUp requires consoles and monitors to use the same credentials. Optionally, to enable continuous monitoring of the virtualization hosts using the monitor, use the page to save the same service account credentials used by other ControlUp users in your organization to connect to your hosts.
However, if you don't provide credentials for hypervisor connections, the monitor can't connect to the hypervisor infrastructure. For more information on monitoring virtualization hosts with ControlUp, see Connect to Your Hypervisors.
Multiple Domains
If you have multiple domains, you can add them all to your monitor and use a monitor service account in each domain. Note that you must set a primary domain. The primary domain is the domain that was used to create your ControlUp organization.
Login Mode
You can select the type of ControlUp login for your monitor instance. If your organization logs in to ControlUp online, leave the default online option selected. In this case, ControlUp will automatically create a new ControlUp user account for your monitor instance.
Proxy Settings
Optionally, if your network policy requires the use of a proxy server to connect to the internet, use the Proxy tab to configure your proxy server settings and authentication credentials.
For more information, see Proxy Settings.
Export Schedule (versions 9.0 and lower)
Deprecation of Export Schedule in 9.1
From version 9.1, the Export Schedule has been deprecated from the Real-Time DX Console. The deprecated Export Schedule screen still displays in Monitors Settings, but we will remove it in a future version. To configure export rules, use the Export-CUQuery cmdlet.
Optionally, in the Export Schedule tab, you can configure the Export Schedule feature to allow ControlUp to record any activity displayed in the My Organization pane. Add export rules if you need your monitor export real-time data in comma-delimited logfiles that you can use to create reports.
If your ControlUp Console is already configured to export data on a scheduled basis, the Monitor Configuration Wizard will offer you to move your export rules from your personal settings to the ControlUp Monitor. If you choose to agree, the monitor service starts exporting the data instead of your console, eliminating the need to keep a console open in order to produce data reports. You can configure additional export rules for the monitor.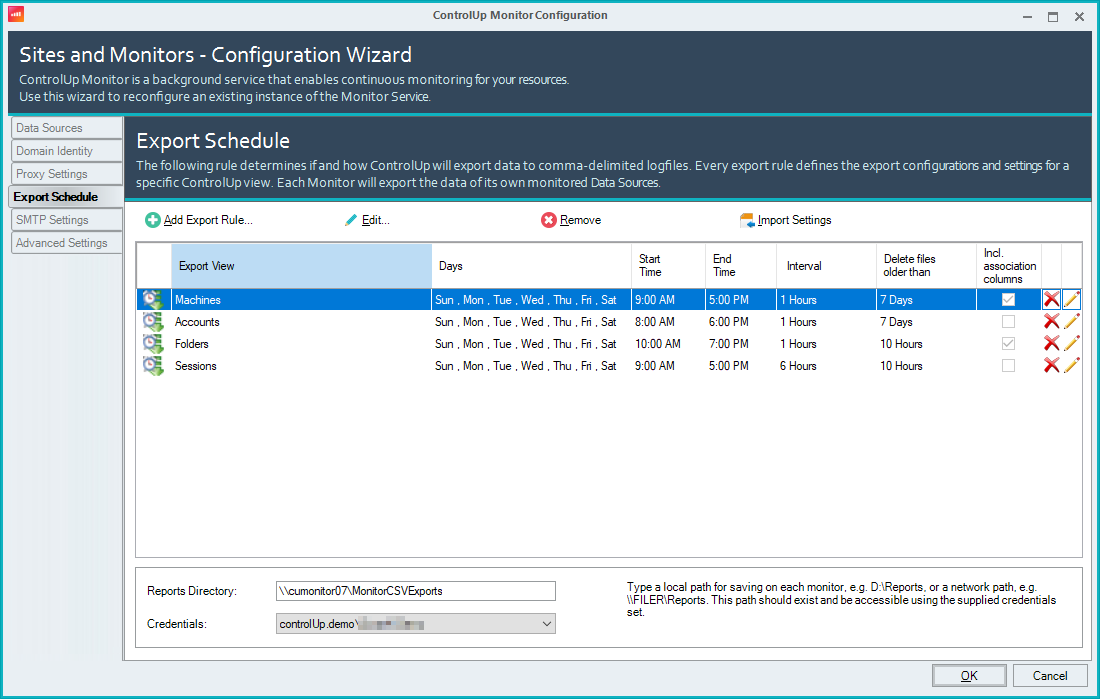
In order to use the Export Schedule feature, you must configure the export path for the CSV files, as well as a credentials set that is sufficient for the monitor to write files to that directory. The export path can be either a local or a UNC path. If you configure the Delete files older than… option to delete old files, the configured account also requires permission to delete files in the directory.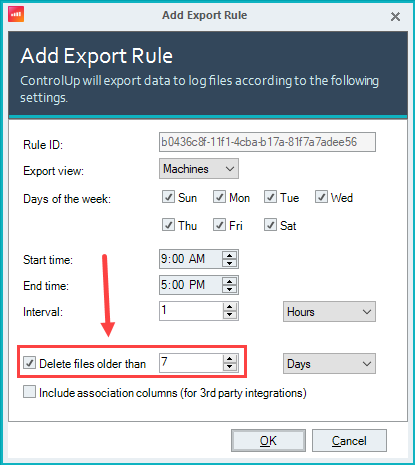
VDI App Settings
Our VDI App uses the ControlUp Monitor to retrieve data from your data sources. This dialog links to the web UI interface where you can configure SAML SSO. To learn how to setup web interface SAML SSO, see here.
SMTP Settings
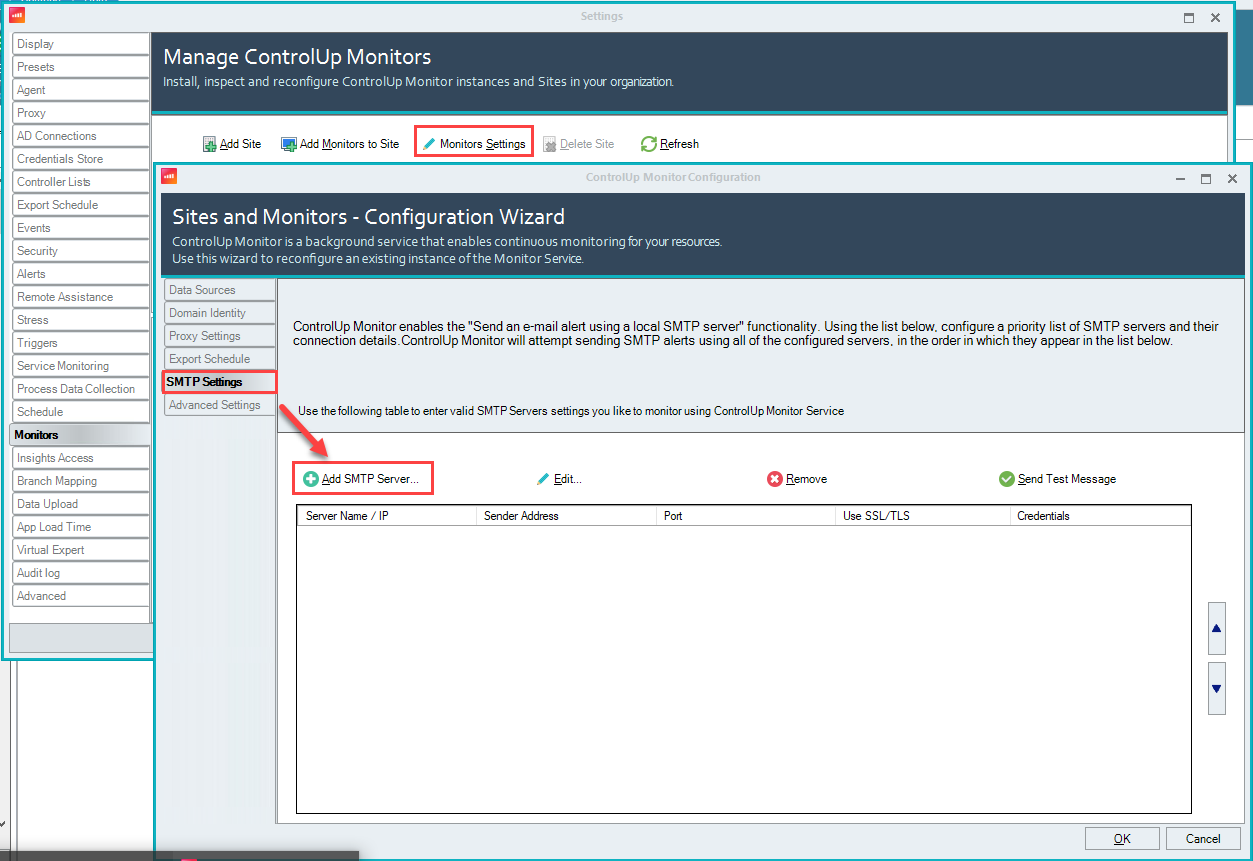
ControlUp supports sending email alerts using a user-provided SMTP server, which is useful if you can't or prefer not to utilize the built-in cloud alerting service. To route alert messages to a custom SMTP server, you must configure the monitor service with the server name or IP, sender details, and credentials.
If you don't enter any information in the SMTP Settings tab of the Monitor Configuration Wizard, triggers using the Send an email alert using a local SMTP server follow-up action will fail to generate email alerts.
Advanced Settings
You can configure the monitor to regulate information updates from the agents. Use the Advanced Settings tab of the wizard to optimize resource consumption by the monitor machines.
For more information about regulating information updates and its impact on the performance of ControlUp, see Advanced Monitor Settings.
Service Port
After you initially install and configure a monitor, the Choose Servers tab is available in the ControlUp Monitor Installation Wizard. You can use it to configure a TCP listening port for the ControlUp Monitor service. The default port is 40706.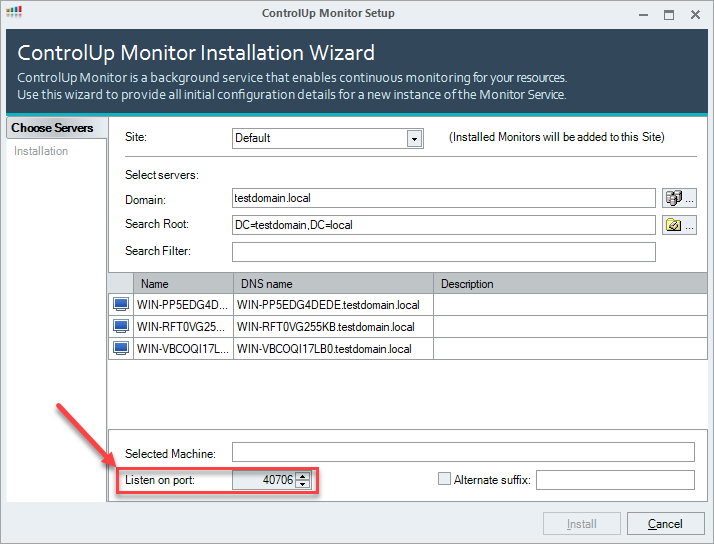
The monitor is similar to the console, acting like a client that connects to a listening TCP port (40705 by default) on the managed machines. The monitor listens on port 40706 only to allow other installed consoles in your organization to receive status updates and to display the status of the monitor in the Real-Time Console.
Note
The monitor doesn't use port 40706 to communicate with managed machines.
For more information about communication ports used by ControlUp, see Communication Ports Used By ControlUp: Hybrid Cloud for hybrid cloud environments, or Communication Ports Used by ControlUp On-Premises Mode for on-premises deployments.