The following article describes some of the alerts you might receive that the monitor isn't working properly.
No Monitor Activity
This alert indicates that your monitor service is either not running or can't connect to ControlUp's servers. To fix this, check the following:
From the ControlUp Real-Time DX Console, click Settings > Monitors. Expand the problematic monitor.
- When working properly, it should have the
 icon and status indicating that the monitor is running properly.
 - If not, it appears as follows:
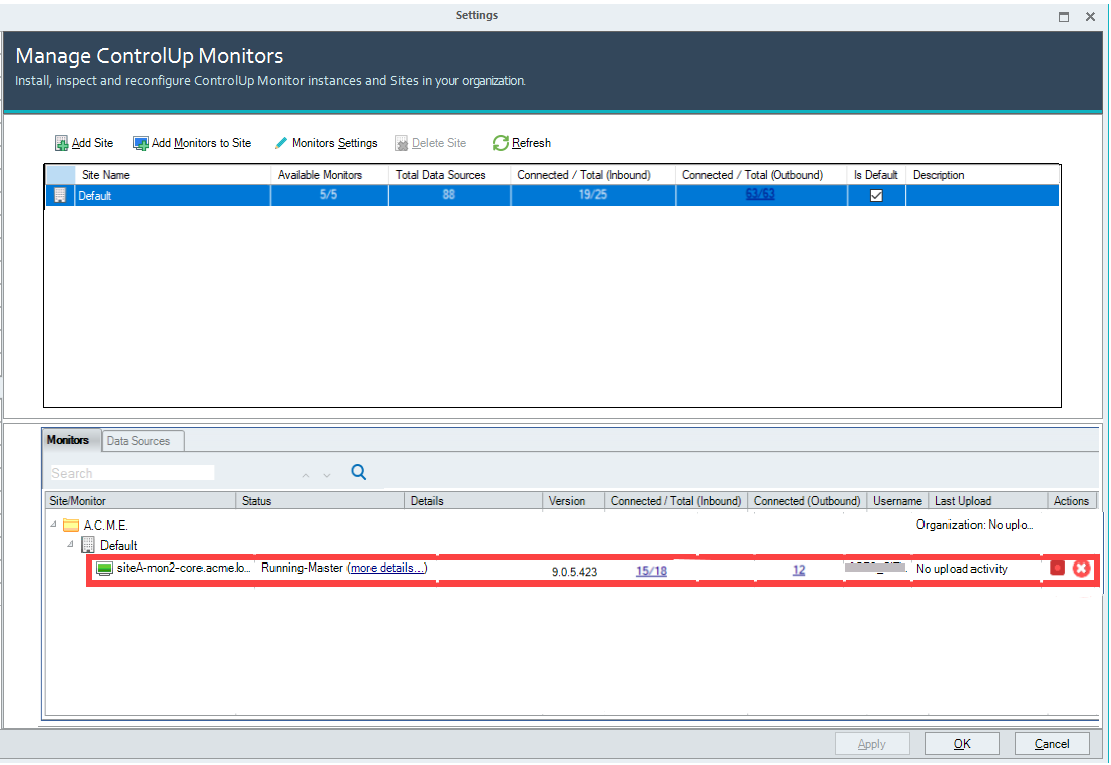
- If the status shows that it is not running, Start the monitor service. If you can't get it to run contact our support team.
- If the status is running, but still fails to upload data, verify that the machine running the monitor service can access our backend servers.
- If you are missing data, it might be a proxy issue. For more details, see here.
Low Upload Volume
This alert indicates that you are still uploading data, but the volume of data has dropped in comparison to the same time last week.
This may be intentional due to migration or holiday. However, it can also indicate that the monitor can't connect to some machines due to a service account that's locked or a password change.
In the Monitors screen, you can see the relevant errors in the Summary pane, or the Connected/Total (Inbound) and Connected (Outbound) columns:
- Summary: Resources connected display lower number of connected machines.
- Connected/Total (Inbound): Click the Connected/Total (Inbound) number to view all inbound agent connections with the monitor. The root cause might be outdated agents not upgraded, no connection using the inbound port 40705, missing organization credentials, mismatched machine, agent service not running, etc.
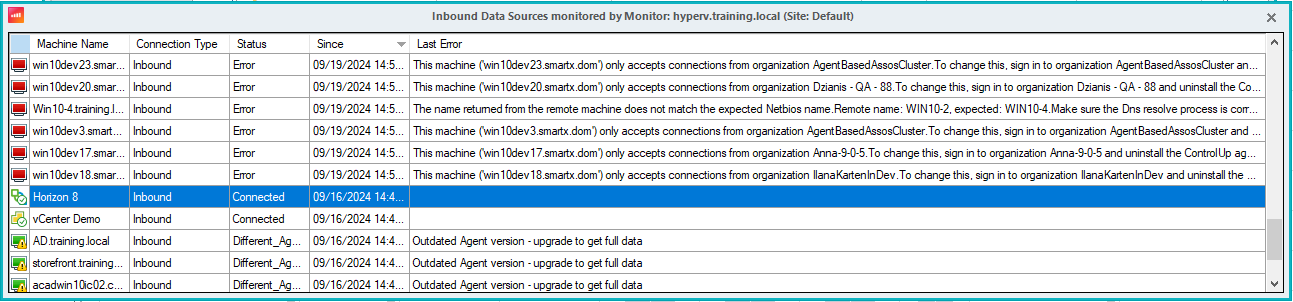
- Connected (Outbound): Click the Connected (Outbound) number to view all outbound agent connections with the monitor.
Monitor Disconnected from Hypervisors
This alert indicates that your ControlUp Monitor isn't connected to one or more of your extensions, for example Hypervisors, EUC environments, or Citrix ADC. This is usually due to changing a service account's password or a locked user.
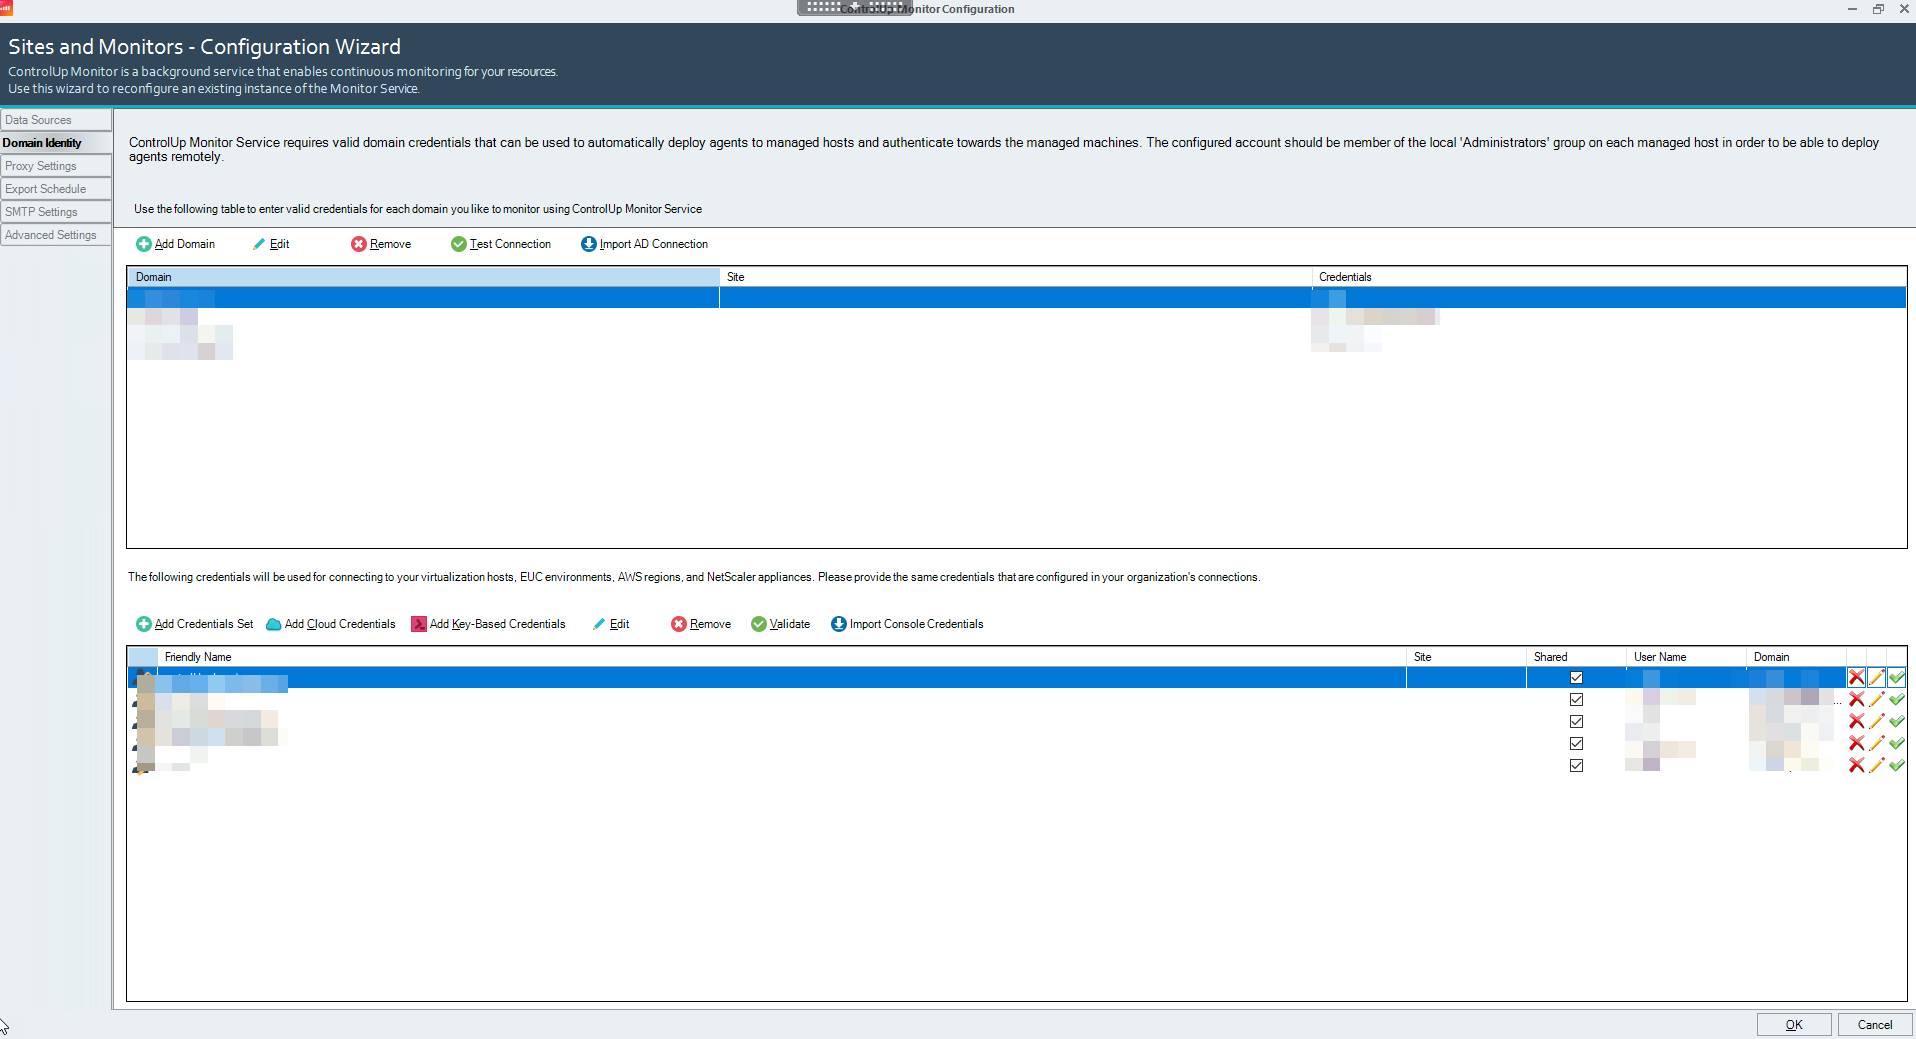
To verify the user, click Settings > Monitors > Monitors Settings, then edit the user/password in the bottom pane:
For more information, see Connect to your Virtualization Infrastructure.
Missing Shared Credentials
Your monitor cluster might not have access to Configuring Shared Credentials which the monitors use to connect to your monitored extensions, such as Omnissa Horizon (formerly VMware Horizon) or CVAD. In most cases, this error appears when credentials were changed without updating them in the Real-Time Console.
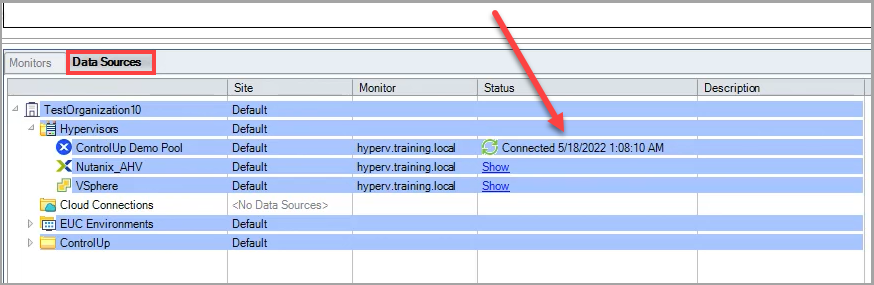
To check the credentials of your monitor cluster, click Settings > Monitors > Data Sources. Click Show in the Status column of specific data sources to verify that there are no errors based on credentials.
To add or edit credentials, click Monitors Settings > Domain Identity. In the credentials table, add or edit specific credentials as needed.
Process on Demand Enabled (8.8 and lower)
Note that the disable process settings were removed in Real-Time DX version 8.8.
From version 9.0, you can use the Process Data Collection feature.
For versions lower than 8.8, if you receive this alert, it means that the Advanced Setting Disable views that depend on process-level information is selected. Enabling this option means that no process-level information will be shared to the monitors. It is best practice not to select and enable this option.
Information Updates Regulation Not Enabled
If you receive this alert, it means that the Advanced Setting Do not regulate information updates is selected. By default, without this option selected, the activity reported from the agents to the monitors is regulated. The monitors approach the agent at a set interval, at an average of 3 seconds, and request that they push the data. Selecting this option means that there are unregulated updates to the information being reported from the agents to the monitor. While this may provide faster updates than the average of 3 seconds, this is very resource-intensive and might cause undue strain on the monitors.
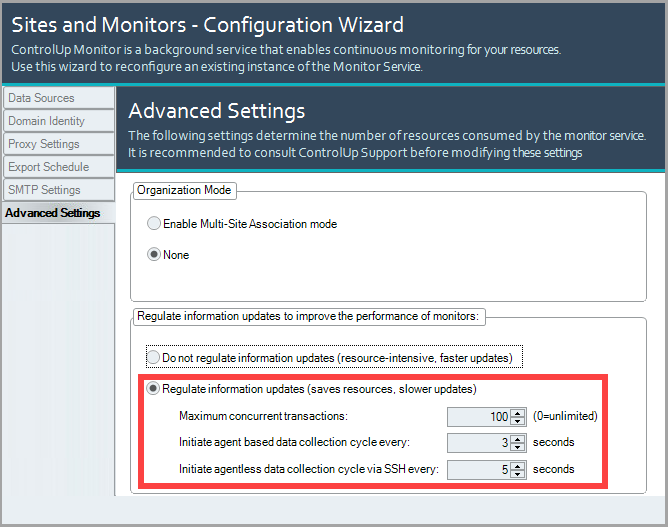
For more details, see here.
Insufficient Data Uploaded
If you receive this alert, it means that your monitor is uploading incomplete information. ControlUp might be unable to produce meaningful reports based on this data. The monitors have previously uploaded process, session, and machine data, but have now stopped.
This might be caused by a monitor-agent communication issue. To remedy this issue, restart the monitor machine.
If restarting the monitor doesn't remedy the issue, and it still uploads insufficient data, see above Low Upload Volume for more ways to diagnose and remedy the issue.