Columns & Grids
Folders
Column | Description |
|---|---|
Avg. Sessions Per Machine | Average number of user sessions per machine |
CVAD % Available Delivery Groups | Percentage of available CVAD Delivery Groups |
CVAD % Available Machines | Percentage of available CVAD machines (Not In Maintenance, Enabled and has at least one available machine) |
CVAD App Instances Running | Count of CVAD published application instances currently running on all machines in the folder |
CVAD Apps Published | Total number of published CVAD applications |
CVAD Apps In Use | Count of distinct CVAD published applications currently running on all machines in the folder |
CVAD Available Machines | Number of CVAD machines in "Available" state |
CVAD Average Logon Duration | Average logon duration for all CVAD sessions, from the Citrix perspective |
CVAD % Healthy Brokers | Percentage of available CVAD Brokers |
CVAD Data Collection Application Instances Requests | Number of requests sent to generate the complete dataset for running application instances |
CVAD Data Collection ApplicationInstances Time | Time taken to complete the collection requests for running published applications |
CVAD Data Collection Applications Requests | Number of requests sent to generate the complete dataset for published applications |
CVAD Data Collection Applications Time | Time taken to complete the collection requests for published applications |
CVAD Data Collection Catalogs Requests | Number of requests sent to generate the complete dataset for machine catalogs |
CVAD Data Collection Catalogs Time | Time taken to complete the collection requests for machine catalogs |
CVAD Data Collection Cloud Connectors Requests | Number of requests sent to generate the complete dataset for cloud connectors |
CVAD Data Collection Cloud Connectors Time | Time taken to complete the collection requests for cloud connectors |
CVAD Data Collection Delivery Groups Requests | Number of requests sent to generate the complete dataset for delivery groups |
CVAD Data Collection Delivery Groups Time | Time taken to complete the collection requests for delivery groups |
CVAD Data Collection Machine | Name of the machine that performed the data collection cycle |
CVAD Data Collection Machines Requests | Number of requests sent to generate the complete dataset for machines |
CVAD Data Collection Machines Time | Time taken to complete the collection requests for machines |
CVAD Data Collection Resource Locations Requests | Number of requests sent to generate the complete dataset for resource locations |
CVAD Data Collection Resource Locations Time | Time taken to complete the collection requests for resource locations |
CVAD Data Collection Retry Count | Number of 429 errors returned in the last data collection cycle. Citrix Cloud permits 10 requests per second per customer ID. |
CVAD Data Collection Retry Count (Past Hour) | Number of 429 errors returned in the past hour. Citrix Cloud permits 10 requests per second per customer ID. |
CVAD Data Collection Sessions Requests | Number of requests sent to generate the complete dataset for sessions |
CVAD Data Collection Sessions Time | Time taken to complete the collection requests for sessions |
CVAD Data Collection State | Overall health of the last data collection cycle. Healthy, if cycle completed under 2 minutes without any 429 errors. Unhealthy for all other scenarios. |
CVAD Data Collection Total Time | Total time of the last data collection cycle |
CVAD Last Successful Data Collection | Timestamp when the last data collection cycle completed |
CVAD Delivery Group Availability | For a CVAD Delivery Group, Indicates whether the delivery group is available (enabled, not in maintenance mode and has available machines) |
CVAD Delivery Groups | Total number of Delivery Groups |
CVAD Desktop Instances Running | Count of CVAD published desktop instances currently running on all machines in the folder |
CVAD Disconnected Sessions | Number of CVAD disconnected user sessions |
CVAD Failed Machines | Count of CVAD machines in "Unregistered", "Stuck on Boot", or other failed states |
CVAD in Use / Published Apps Ratio | Percentage of published CVAD applications currently in use on all machines in the folder |
CVAD Machines In Use | Number of CVAD machines currently in use |
CVAD Minimum Functional Level | Indicates which product features are available to machines linked to the delivery group |
CVAD Site Name | Name of the CVAD site |
CVAD Total Desktops | Total number of CVAD machines |
CVAD Unregistered Machines | Number of CVAD machines in "Unregistered" state |
CVAD User Connection Failures Per Hour | Rate of failed user connections to CVAD in the last hour |
CVAD User Sessions | Total number of CVAD sessions |
Machines | Total number of machines |
Name | Folder name |
Stress Level | Stress Level is a flexible load measure which you can customize using the "Stress Settings" pane. |
Machines
Column | Description |
|---|---|
CVAD Allocation Type | Indicates how the machines in the catalog are allocated to a user |
CVAD Average Logon Duration | Average logon duration for all CVAD sessions, from a Citrix perspective |
CVAD Delivery Type | Type of resources published in the CVAD delivery group ("desktops only", "apps only", "or desktops and apps") |
CVAD Desktop Kind | Indicates if the published desktop is shared or private |
CVAD Failure Time | For a CVAD machine in a failure state, the time the failure occurred |
CVAD Maintenance Mode | Indicates if the machine is in maintenance mode |
CVAD Pending Image Update | Indicates if the VM image for a hosted machine is out of date |
CVAD Registration | Registration state of the current machine against the connection broker |
Name | Machine name |
Operating System | Operating System Version |
PVS Device Boot Retry Count | Number of retries made to boot the PVS target device |
PVS Device Boot Time | Time it takes for the PVS target device to boot in seconds |
PVS Device Disk Type | Type of disk from which the target device boots from (vDisk, local disk, etc.) |
PVS Device Free Space on Write Cache | Specifies the free space left in the write cache drive and the drive letter |
PVS Device Server Reconnect Count | Total number of network reconnections from the PVS server, including network issues, PVS server rebalancing, and stream service stability |
PVS Device UDP Retry Count | Number of UDP retries from the target device to the PVS server |
PVS Device Version | Version of the PVS target device |
PVS Device Write Cache Type | Specifies the write cache type configured for the vDisk |
PVS Device Write Cache Volume Size | Specifies the total volume size of the write cache drive on a PVS target device |
PVS RAM Cache Usage | Size of the Citrix PVS RAM cache |
This is a health column that it calculated based on the following values in:
Find more information here. | |
PVS vDisk File Name | For a Citrix PVS target device, the name of the vDisk from which the machine was booted |
PVS vDisk Mode | Specifies the current mode of the PVS vDisk (Standard - read only, Private - read/write) |
Status | ControlUp Agent connection status |
PVS Target Device Health
The indicator shown in the PVS Target Device Health column helps you to investigate health issues with your PVS target device.
The indicator is calculated using the following metrics:
PVS Device UDP Retry Count
PVS Device Server Reconnect Count
PVS Device Boot Retry Count
PVS Device Free Space on Write Cache
The table below shows the aggregated severity level (as the sum of the loads of all 4 columns) and the indicator shown in the Real-Time Console and the web UI.
Severity Level | Indicator |
|---|---|
0 - 2 | Good |
3 - 4 | Average |
5 - 6 | Poor |
7 + | Critical |
For example, assuming the load of the PVS Device UDP Retry Count and the PVS Device Server Reconnect Count is 2, the calculation would be 2 + 2 = 4. In this case, the value Average is displayed in the PVS Target Device Health column.
Click the  icon to view the values for the calculation.
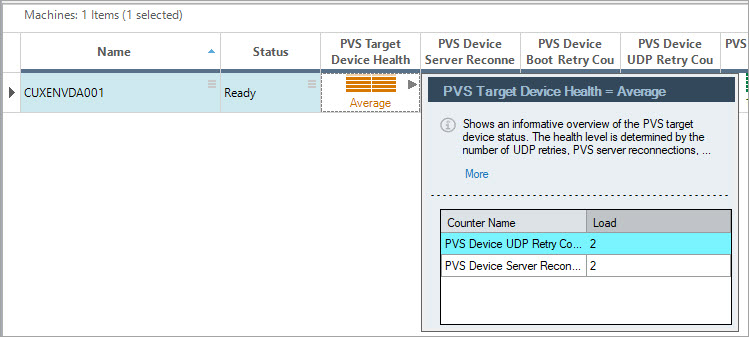
You can find the calculation of the load in the table below. The variable x stands for the value shown in the column:
Column | Threshold | Load |
|---|---|---|
PVS Device UDP Retry Count | x <= 11 | 0 |
PVS Device Server Reconnect Count | x > 1 | 1 |
PVS Device Boot Retry Count | x < 1 | 0 |
PVS Device Free Space on Write Cache (in %) | x > 31 | 0 |
Note
The PVS Target Device Health metric is relevant only for Citrix Provisioning target devices and from PVS target device versions 1912 LTSC CU and higher. If the machine isn't a target device, the value "N/A" is displayed.
Sessions
| Column | Description |
|---|---|
| Apps In Use | Name of the published application/s in the session |
| Apps In Use Count | Count of all published applications running in the session |
| Citrix Workspace App Version | Current version of the Citrix Workspace app installed on the client's machine. |
| Client Device Score | Experience stress score of the client device based on the worst threshold among these metrics: Client WiFi Signal, Lan Latency, Total Session Latency, Internet Latency |
| Client IP | IP address of the client machine connected to the session |
| Client Name | Machine name of the client machine from which the session is currently established |
| CVAD Adaptive Transport | If set to Preferred, EDT is used as the primary transport protocol and TCP is used for fallback. If set to Diagnostic mode for testing purposes, it only allows EDT and disables the fallback to TCP. If set to None, it only allows TCP. |
| CVAD Authentication Duration | Authentication duration in milliseconds |
| CVAD Brokering Duration | Brokering duration calculation in milliseconds |
| CVAD Connected Via HostName | Host name of the gateway, router or client via which the connection is established |
| CVAD Delivery Group | Name of the CVAD Delivery Group to which the machine hosting the session belongs |
| CVAD Disconnect Date | Time stamp of Disconnect event |
| CVAD Disconnect Reason | Reason for the session disconnection |
| CVAD EDT Congest Window | EDT congestion window size in number of packets |
| CVAD EDT Flow Window | EDT flow window size in number of packets for the specified time interval |
| CVAD EDT MTU | Space available in the EDT sender queue, in number of packets |
| CVAD EDT Packets Received | Total number of EDT packets received, including retransmissions |
| CVAD EDT Packets Sent | Total number of EDT packets sent, including retransmissions |
| CVAD EDT Received Packets Lost | Total number of incoming EDT packets that were lost |
| CVAD EDT Sent Packets Lost | Total number of outgoing EDT packets that were lost |
| CVAD Rendezvous Version | The Rendezvous protocol bypasses the Citrix Cloud Connectors. Version 1 (V1) bypasses HDX session traffic only. Version 2 (V2) bypasses both control traffic and HDX session traffic. |
| CVAD Establishment Date | Time stamp recorded on the Broker when the VDA confirms session connect / reconnect maps to Resolution Time in Desktop Director UI |
| CVAD Group Policy Load Time | Duration of the Group Policy Load Time |
| CVAD HDX Connection Load Time | Duration of the HDX load time |
| CVAD Interactive Session Load Time | Duration of Interactive Load Time |
| CVAD Launched Via Host Name | Host name of the StoreFront server used to launch the session |
| CVAD Logon Duration | Total logon duration for this session (in milliseconds) |
| CVAD Logon Scripts Load Time | Duration of the Logon Scripts Load Time |
| CVAD Profile Load Time | Duration of the Profile Load Time |
| CVAD Published Resource Type | Type of CVAD published resource (desktop / application) used in this session |
| CVAD Session Create Time | Time the session started (logon) |
| CVAD Session Reconnected | Indicates whether this connection is a reconnection to an existing session |
| CVAD Site Name | Name of the CVAD site |
| CVAD VM Start Duration | Duration of the start of the VM |
| ICA File Download Duration | Time in milliseconds for the client to download the ICA file from the server |
| Last Reconnect Time | Timestamp of the most recent successful reconnection completion on the server |
| Location | Specifies the resource location for Citrix Cloud Sessions |
| Machine | Name of the machine hosting the session |
| Name Resolution Web Server Duration | The time it takes for the web server to look up and resolve the addresses of the Citrix infrastructure components needed to establish your connection |
| Protocol Type | The protocol that the session is using (HDX, RDP, Blast, PCoIP, Console) |
| RTT | Round-trip time from the user interaction till the graphical response displays, and not just until the network response (as in network latency). Use this metric to measure the screen lag that a user experiences while connected through a Blast, HDX/UDP, or RDP protocol. |
| Session Creation Client Duration | Time taken from when a user initiates a connection to a Citrix session until the session is fully established |
| Session Lookup Client Duration | Time spent on the client device to search for existing disconnected sessions during reconnection attempts |
| Session Startup Client Duration | Time spent on the client device to establish a new session connection to the Citrix server |
| State | Current state of the session (active, disconnected, etc.) |
| Stress Level | Stress Level is a flexible load measure which you can customize using the "Stress Settings" pane. |
| Total Reconnect Time | The complete time a user waits to regain access to their session, measured from when the session startup begins until the reconnection completes |
| User | User name of the session’s owner |
| UX Score | Shows the worst color indication from the following monitored columns: Logon Duration, Protocol Latency - Session Avg, Protocol Bandwidth – Session Avg, Logon Time, Profile Load Time, Group Policy Load Time, Desktop Load Time, Logon Duration - Other, Protocol Bandwidth – Last Recorded, Protocol Latency - Last Recorded, XD Brokering Duration, Avg. App Load Time, XD Authentication Duration, XD Group Policy Load Time, XD HDX Connection Load Time, XD Interactive Session Load Time, XD Logon Duration, XD Logon Scripts Load Time, XD Profile Load Time, User Input Delay |
| Windows Reconnect Processing Time | The time it takes for the Windows server to restore the disconnected session after starting the reconnect |
Applications
Column | Description |
|---|---|
Active Sessions | Number of active sessions running the published application |
Application Display Name | Published application display name is the application name as displayed to the users. |
Application Status | Indicates if the published application is enabled/disabled. |
Available / Published Ratio | For a published application, count of machines on which the application is available (from the EUC solution perspective), divided by the total count of machines on which the application is published |
Available On Count | For a published application, the number of machines on which the application is published (not necessarily running) and which are available from the EUC solution perspective |
Avg. Bandwidth | Average network bandwidth consumed by all sessions running the public resource (desktop / application) |
Avg. Latency | Average network latency of all sessions running the public resource (desktop / application) |
Avg. Logon Duration | Average logon duration for all sessions running the published application |
Avg. Machines CPU | Average CPU usage on managed machines (machines with ControlUp Agent installed) running the resource (desktop / application) |
Avg. Machines Disk I/O Operations/sec | Average amount of read and write disk I/O operations generated per second on managed machines (machines with ControlUp agent installed) running the resource (desktop / application) |
Avg. Machines Memory | Average memory usage on managed machines (machines with ControlUp Agent installed) running the resource (desktop / application) |
Avg. Machines Network I/O Operations/sec | Average rate (in Mbps) at which data is sent and received over all ethernet adapters, including framing characters on managed machines (machines with ControlUp Agent installed) running the resource (desktop / application) |
CVAD App Instances Count | Count of the running instances for a CVAD published application |
CVAD Published App Created | Creation timestamp of the CVAD published application |
Disconnected Sessions | Number of disconnected sessions running the published application |
Machines | Total number of machines on which this application is currently running |
Managed / Running Ratio | For a published application, percentage of machines running the published application on which ControlUp Agent is installed |
Name | The name of the process image or the name of published application |
Published On Count | For a published application, count of machines the application is published on |
Running / Available Ratio | For a published application, count of machines currently running the application divided by the number of machines on which the application is published and which are available from the EUC solution perspective |
Running / Published Ratio | For a published application, count of machines currently running the application divided by the number of machines on which the application is published |
Stress Level | Stress Level is a flexible load measure which you can customize using the "Stress Settings" pane |
Total Sessions | Number of sessions running the published application |
Total Users | Number of users running the published application |