Platform
Global search in Tenant Manager (Jul 28)
Tenant Managers can now use the search bar at the top of the page to quickly search across all your tenants. You can then click to drill down directly to the relevant entity within the tenant.
Use the tenant dropdown to narrow your search to a specific tenant, or search across all tenants. You can also use the following shortcuts when typing a search:
Tenant: <tenant_name>— search within a specific tenant.Product: <product_name>— search within a specific product.
.png)
Dashboards
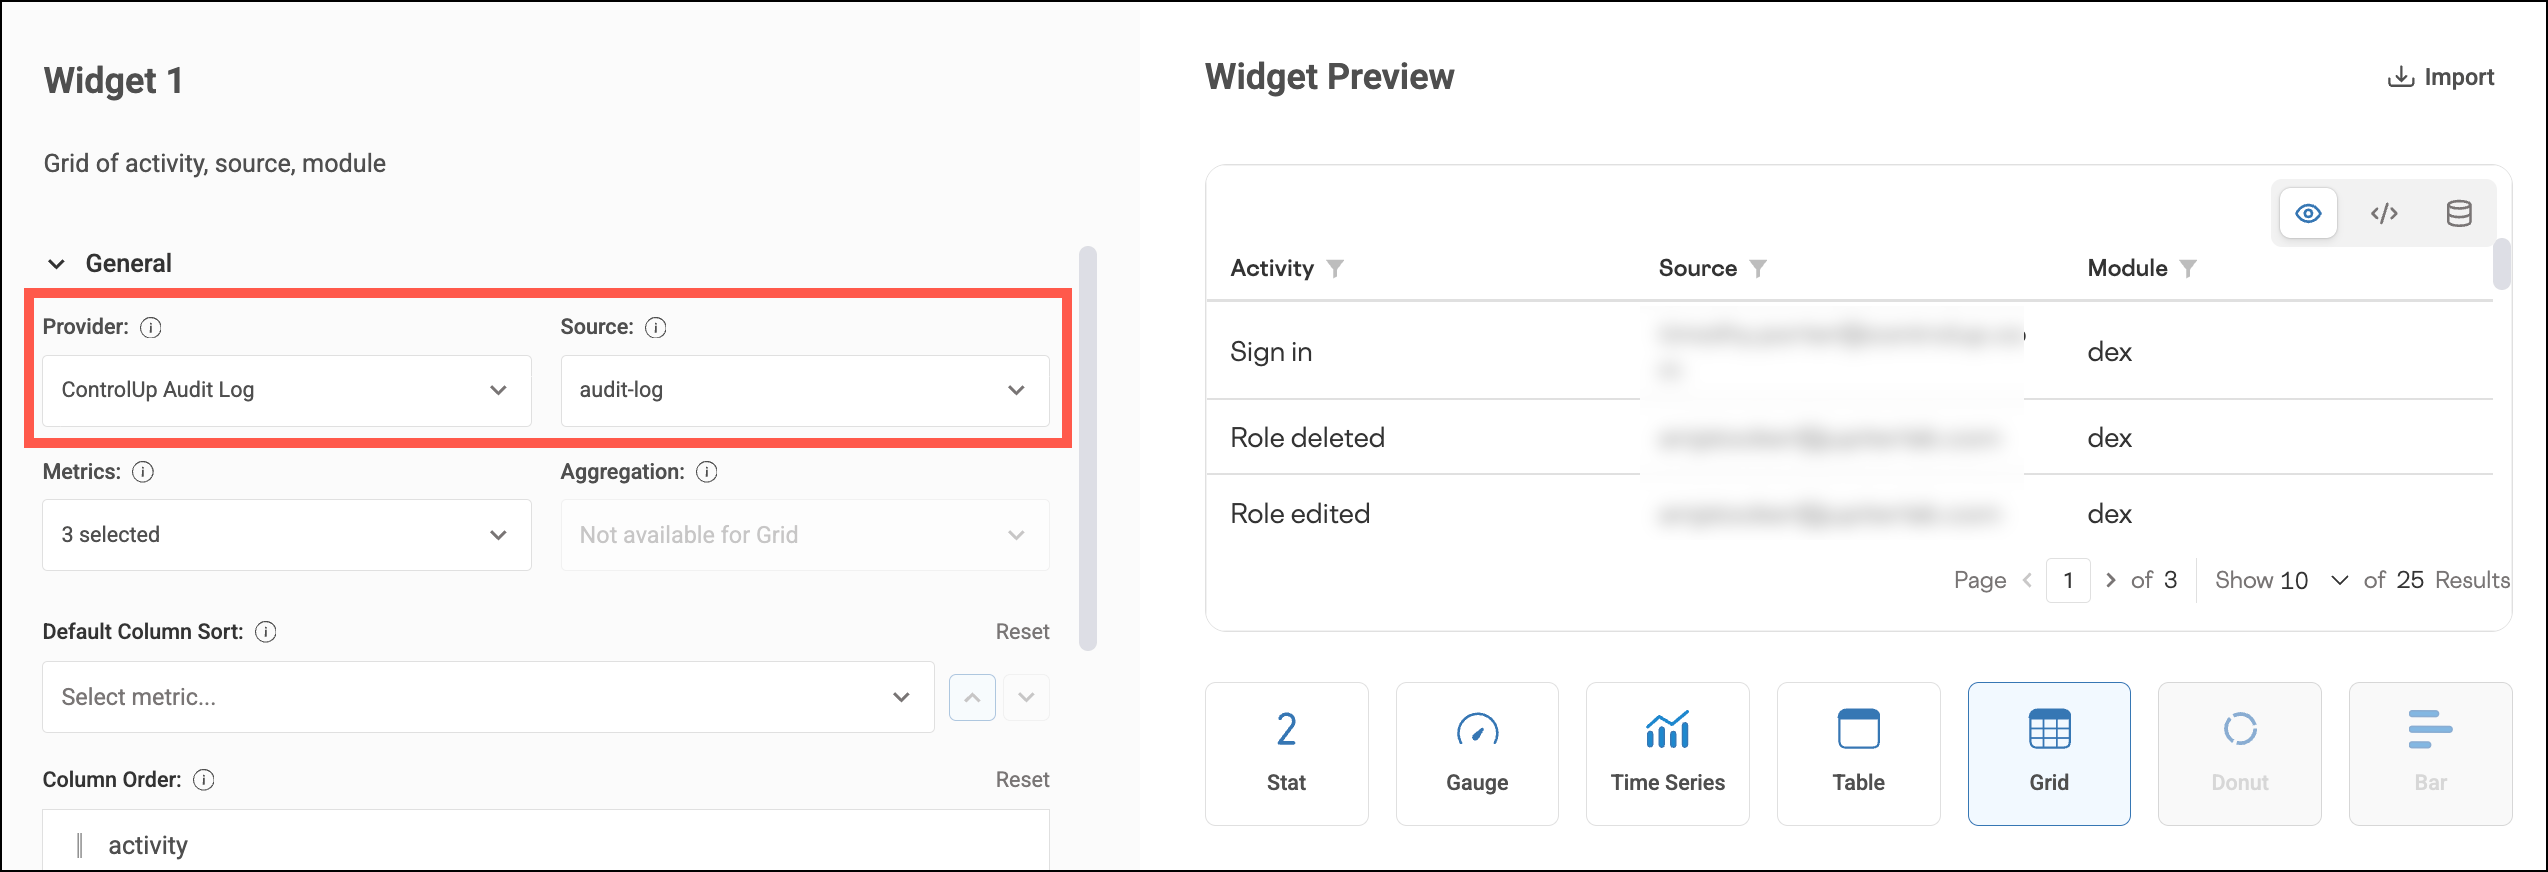
Use the Audit Log as a data provider (Jul 28)
When building a widget, you can now use the ControlUp Audit Log as a data provider. This lets you build dashboard widgets around remote control activity, scripts actions, security insights, and more!
Interactive time-series charts (Jul 28)
Click on a time-series data point to either:
Set a variable based on the selected point.
Zoom in for a more detailed view.
Bug fix for filters (Jul 28)
We fixed an issue where filters saved in a dashboard URL were not correctly reapplied when reopening that URL.
Improved Permissions to Dashboards (Jul 1)
Tag-based Dashboard Access
We’ve made significant improvements to role-based access control by integrating dashboards with our new centralized tag management.
Administrators can now use Tags to create tag-based access controls.
A new dashboard viewer role can be configured so users have access only to dashboards associated with specific tags.
Admins with the Edit Organizational Dashboards can assign one or more tags when sharing dashboards with the organization.
Users only see shared dashboards that match the tags they have permission to access, allowing organizations to safely segment dashboards across teams, departments, customers, or business units.
View Dashboard Gallery Permission
We’ve also introduced a new permission: View Dashboard Gallery
This permission allows administrators to control whether users can access the Dashboard Gallery. Organizations that want to provide only curated dashboards can now hide the gallery entirely from selected user groups.
These RBAC enhancements provide much finer control over dashboard visibility and make it easier for larger organizations and MSPs to manage dashboard access at scale.
ControlUp for Desktops
Get a new Device Registration Code (Jul 22)
You can now create a new, more secure Device Registration Code for your tenant. The new code is longer and generated using an enhanced security algorithm.
A new interface makes it easy to create and manage your Device Registration Codes. To access it, go to Devices > Configuration > Agent Registration. Managing codes is governed by a new permission Manage device registration code, granted by default to the Admin role.
These latest versions of the Agent Manager now support this feature:
2.17.8.394 for Windows
2.18.2.3268 for macOS
To further strengthen security, ControlUp plans to expire all legacy Device Registration Codes on August 31, 2026. We recommend beginning preparations now to update your deployment resources with a new code.
You can create and deploy a new Device Registration Code while your existing code remains valid, allowing you to complete the transition without disrupting your devices.
Windows Agent Manager version 2.17.8.394 (Jul 21)
Added support for new Device Registration Codes generated by a stronger, more secure algorithm.
macOS Agent Manager version 2.18.2.3268 (Jul 21)
Added support for new Device Registration Codes generated by a stronger, more secure algorithm.
Windows Agent version 2.18.0.9849 (Beta 1) (Jul 17)
Beta
This version is currently in beta. To try it out, you can update your version control settings to deploy the beta version to a specific set of devices.
New Features
Remote Control
When an employee reports an issue and then steps away from their device, getting consent for a remote control session can be a blocker. Smart consent bypass solves this by automatically starting a remote session if the device has been idle and the end user doesn't respond to a consent prompt within a configurable timeout. This feature does not bypass consent requirements when a user is active on their device.
Smart consent bypass is disabled by default. It requires a specific permission for the ControlUp user, and it must be enabled on devices using Extended Settings.
Custom consent messages
You can now customize the consent request message that end users see when a remote control session is initiated on their device. The message supports variables so you can include dynamic information such as the name of the ControlUp user requesting access and the type of session being started (view or control).
If you use the new Smart consent bypass feature, you can also customize the message that appears after the session has ended.
Configure these messages in the following new Extended Settings:
Remote Control Consent Message
Remote Control Consent Bypass Notification Message
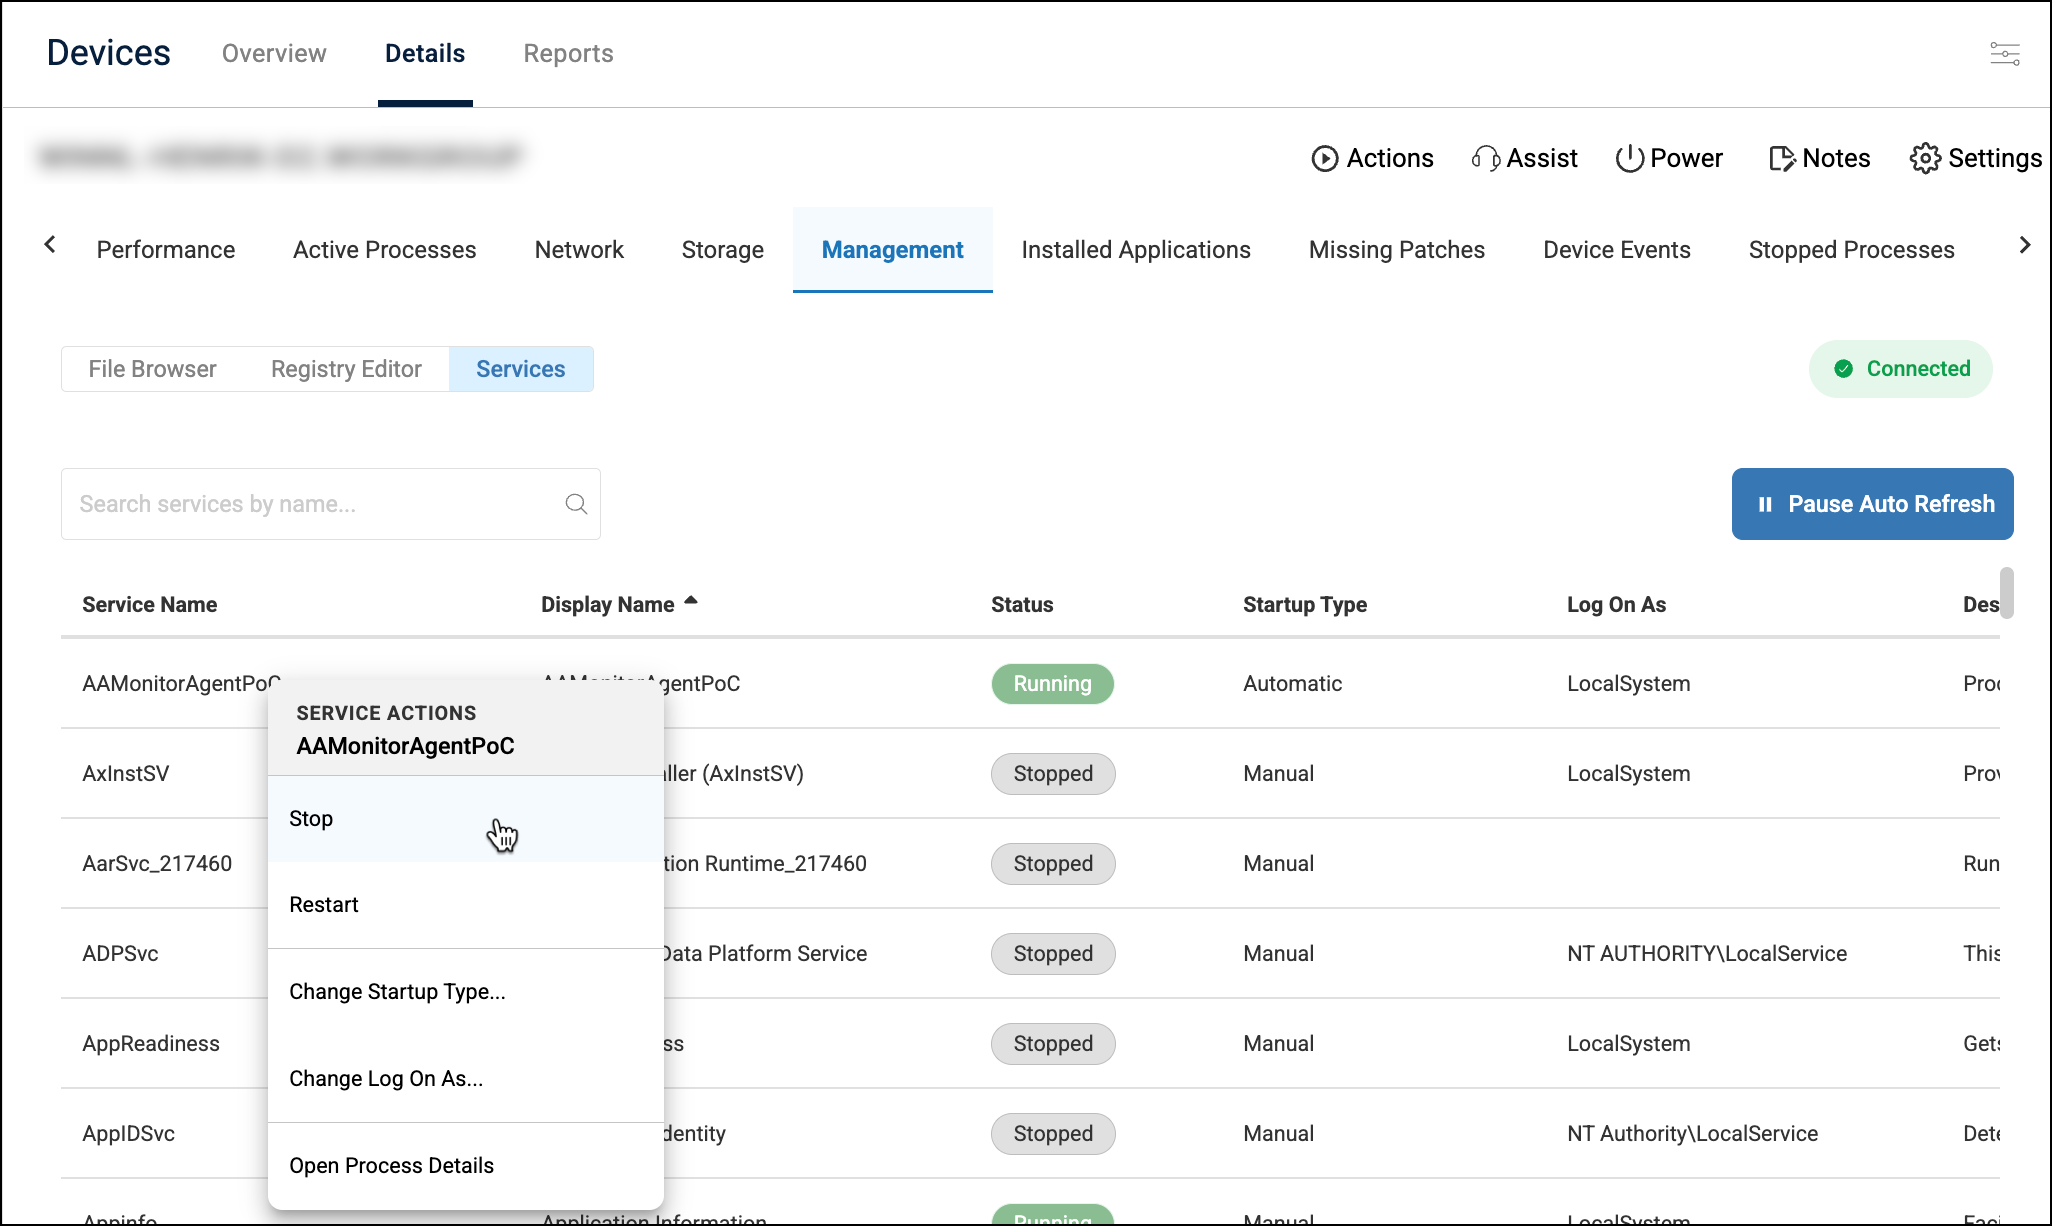
View and manage services
You can now get a live view of services running on a device. Right-click a service to take action or inspect it in detail.
Available actions:
Stop, Start, or Restart the service
Change startup type: Automatic, Automatic (Delayed Start), Manual, or Disabled
Change log on as: Local System, Local Service, Network Service, or This Account
Open process details: See additional information about the service process, including loaded modules and threads
Access services under the Management tab on the device details page.
File browser and registry editor improvements
Separate RBAC permissions for user and system files
The File Browser now distinguishes between user files and system files, giving administrators more precise control over which file types a ControlUp user can access via RBAC permissions.
Note about existing File Browser permissions
Previously, the “System Files” permissions granted access to all file types. Now, they grant access to only system files. This means that you might lose access to user files, depending on how your permissions are set up. You should review your roles and update permissions for system files and user files accordingly.
Access to user hives (HKEY_USERS)
HKEY_USERS is now accessible as a top-level hive in the Registry Editor. Each SID sub-key is resolved to its DOMAIN\Username, making it easy to identify which user's registry hive you are browsing.
Network visibility
VPN and VLAN data collection
The Agent now records whether a device is connected through a VPN, and the device’s VLAN ID. These new fields (on_vpn and vlan) are stored in the data indexes listed in the following section.
Network context stored in additional data indexes
Nine network fields are now stamped onto multiple device indexes at event-write time, enabling you to correlate performance and stability data with the active network state of the device at the moment the event occurred.
New fields:
Location: IP address, subnet, AD site, AD location
Connection type: Interface alias, network type, on VPN, VLAN
WiFi: Channel (in addition to existing SSID, BSSID, signal strength)
Indexes receiving network fields: power_events, win_event_log, process_stops, device_status, builtin_peripherals, builtin_appdx_navigation, builtin_appdx_errors, builtin_ucc_agent_data, url_domains, builtin_session_tracking, netcfg_info, traceroute.
Fixes
File Browser
You can now download write-locked files using the File Browser.
Inventory & Reporting
Fixed an issue where OS platform breakdown widgets occasionally showed incorrect device counts due to invisible characters in the data.
Improved BSOD detection.
Improved reliability of hardware model, manufacturer, and OS name collection.
Windows 11 system processes now correctly report their version number as 10 instead of 6.2 (reflecting the underlying NT kernel version).
Uninstalled Windows services are now correctly reported with a state of Removed. Previously they remained stuck in their last reported state.
Performance & Stability
Fixed an issue causing elevated login durations due to sleep or hibernation events being misinterpreted.
Improved UDP transport detection reliability for Windows 365 Cloud PC environments.
Scripting
Process names used to trigger scripts on process start are now matched case-insensitively.
Employee Sentiment Survey
Active user detection improved — Fixed an issue that could prevent surveys from appearing.
Survey interaction tracking improved — Each survey stage (such as received, notified, snoozed, completed) is now recorded in the user_sentiment_visits data index.
Survey links fixed — Fixed an issue causing links inside surveys to not work correctly.
Removed zoom on image hover — Removed the hover zoom effect on survey images, which could cause them to appear blurry or distorted.
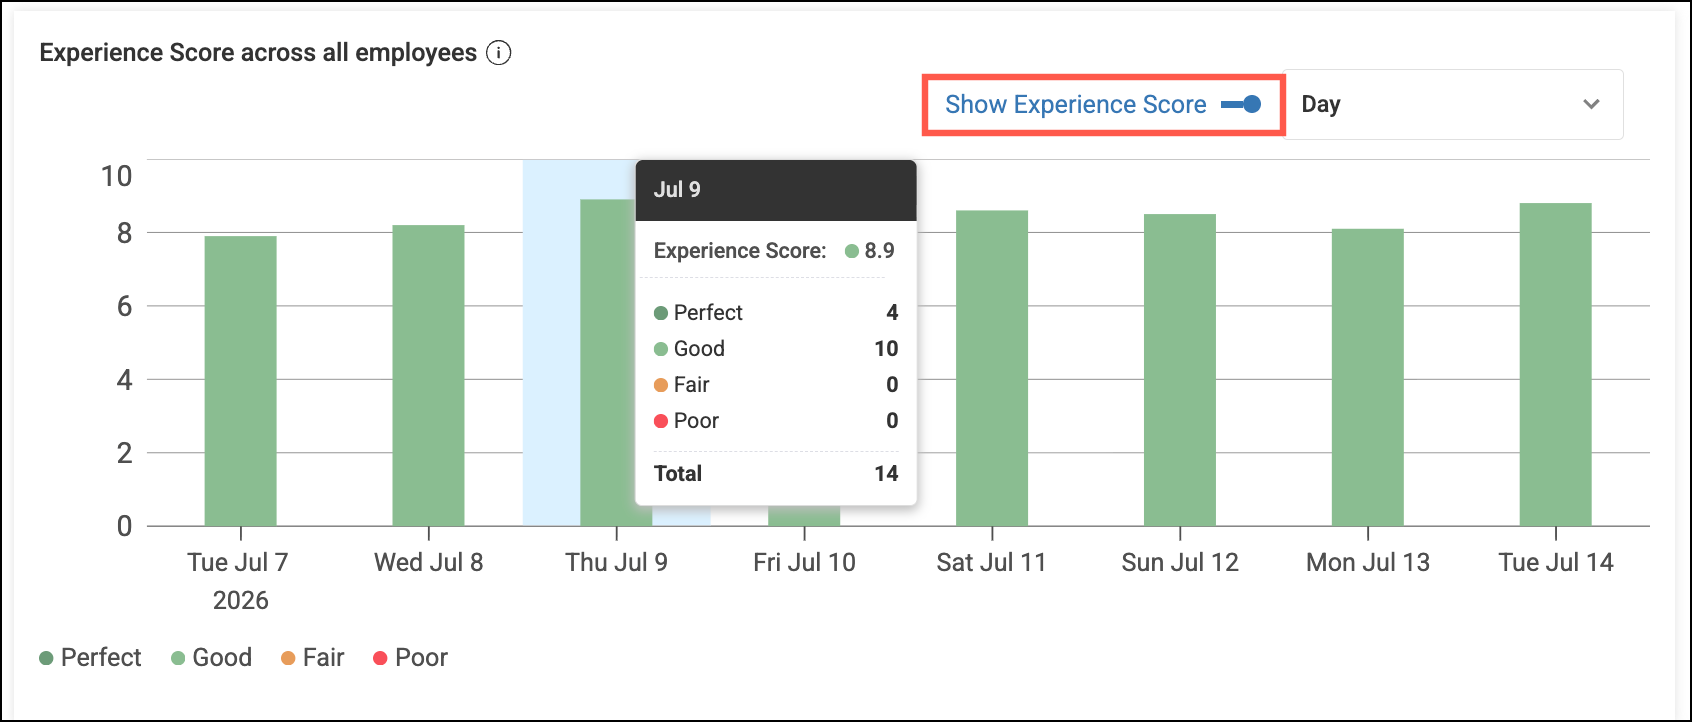
Employee Dashboards improvements (Jul 15)
See experience score over time: In the Active Employees by Experience widget on the Overview page, you can now click the Show Experience Toggle to switch to showing the average experience score over time.
Shareable filtered views: When you apply filters, they are now reflected in the URL. This lets you save or share the URL with a set of filters already applied.
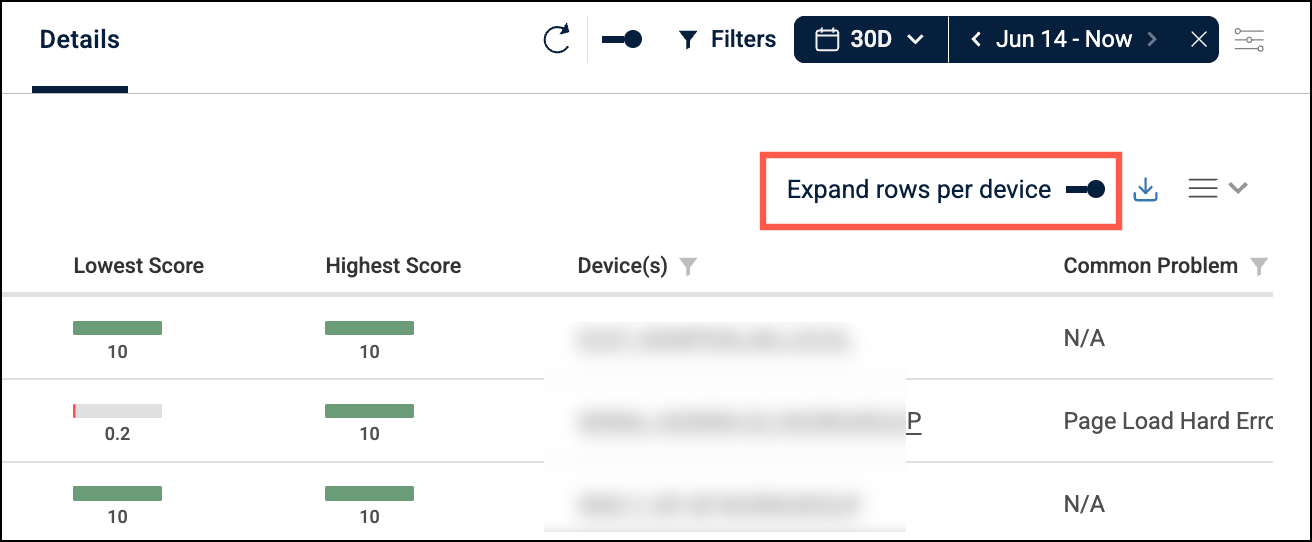
See per-device metrics for employees using multiple devices: By default, in the Details grid, employees using multiple devices are condensed into a single row. You can now enable the Expand rows per device toggle to display one row per device, letting you see more metrics from each device.
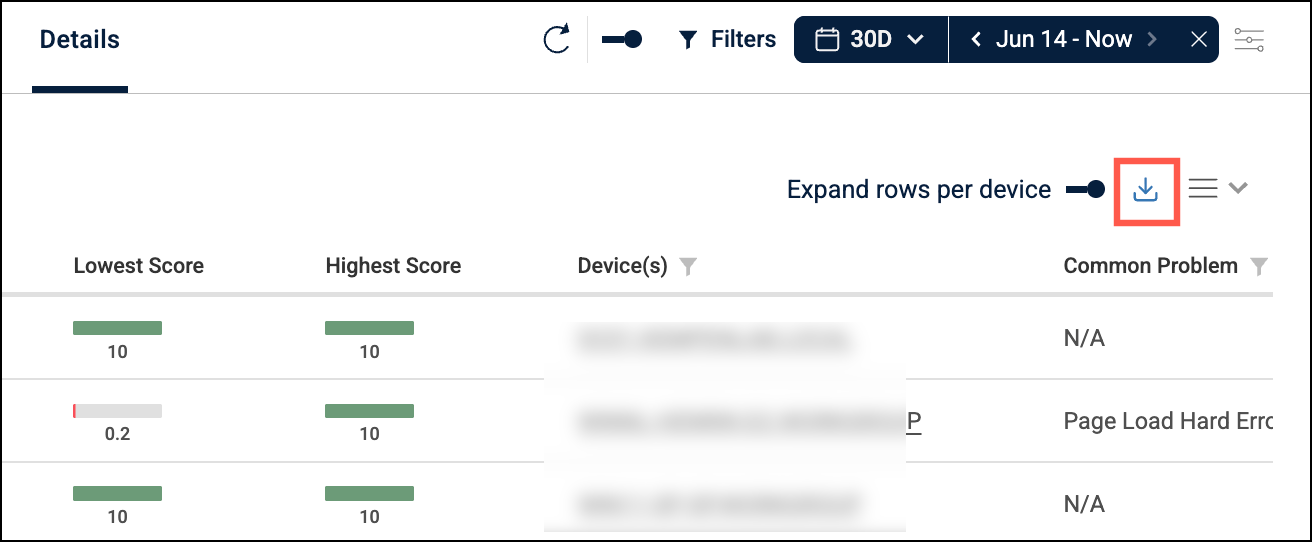
Export Details grid to CSV: You can now export the Details grid to a CSV file. The CSV reflects your current view and applied filters.
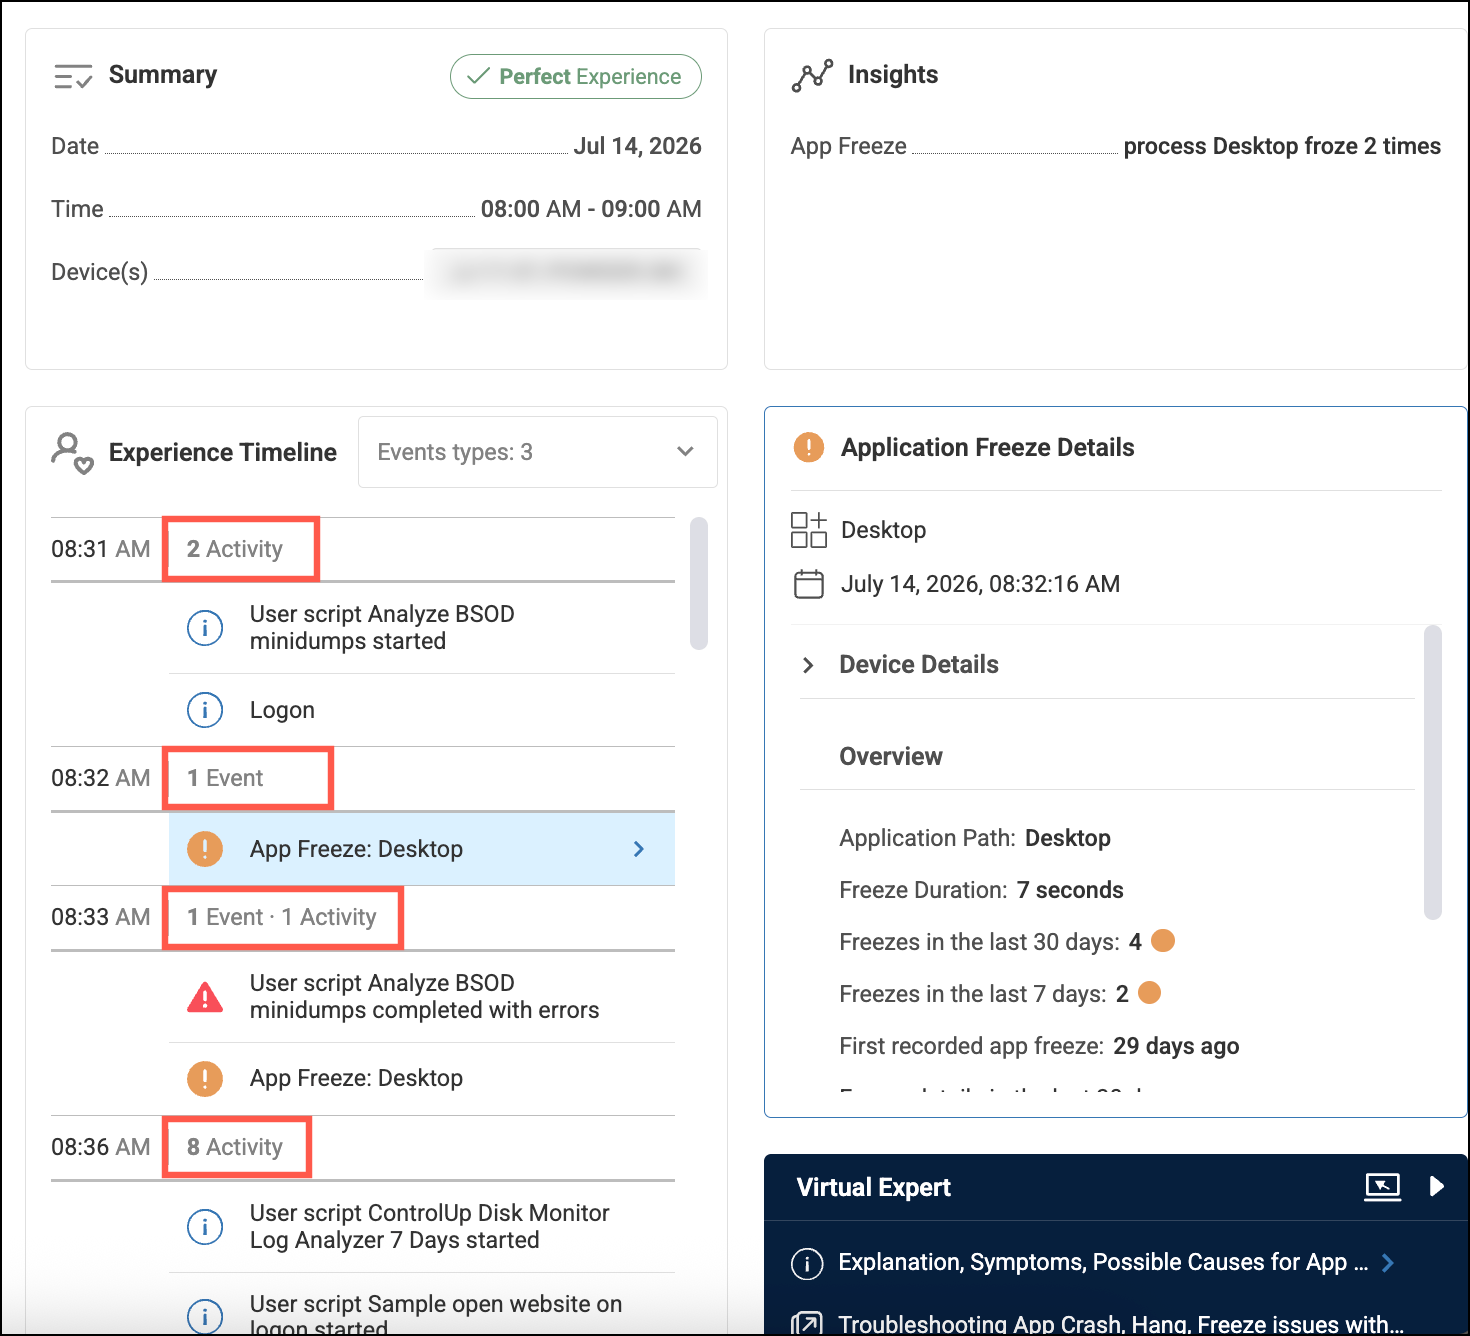
Experience Timeline distinguishes between activities and events: When you drill down into an employee’s experience, the Experience Timeline is now broken down by Activities (device power events and ControlUp actions such as scripts or remote control sessions) and Events (app crashes/hangs/freezes or BSODs).
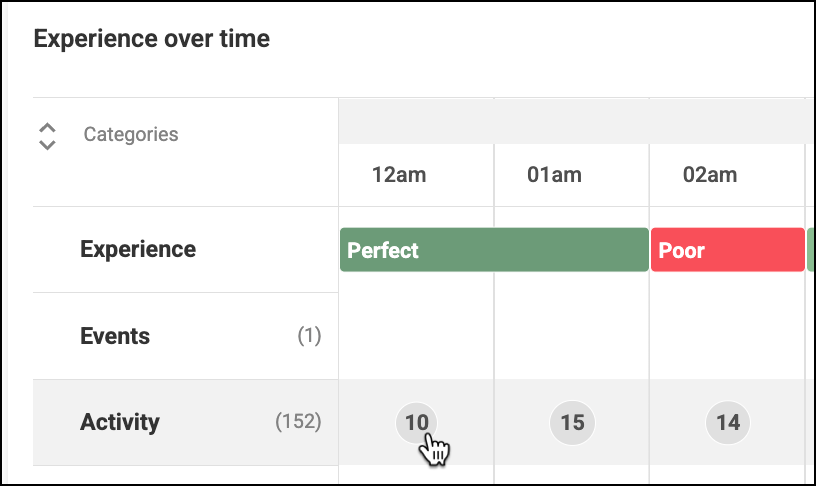
Clicking an employee’s activities or events now filters to show you what you clicked on: When viewing an employee’s experience over time and you click on an activity or event, the Experience Timeline in the drilldown is now automatically filtered to show you the activity or event you clicked on.
Removed employee search bar: We removed the employee search bar now that the global search bar has been implemented throughout the platform.
Fixed 65,000 employee limit: The number of employees displayed on the Overview page is no longer capped at 65,000.
Enrich browser extension version 2.0.29 (Jul 2)
Improved validation of wildcards when used in site URLs: When wildcards are used as part of a site URL, for example
https://*.mycompany.com/*, there is an improved validation to prevent misconfigured sites.
Note that it may take some time before the new version is available in the Chrome and Edge web stores.
ControlUp DaaS IQ
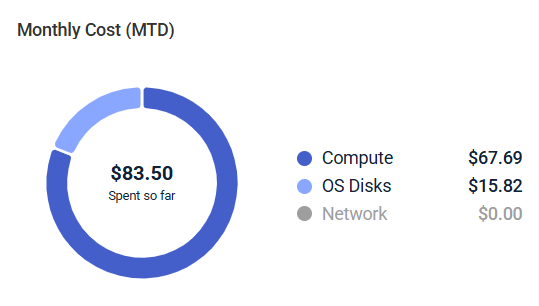
Host Pool Monthly Cost Widget: Refreshed Layout (Jul 27)
We've redesigned the Monthly Cost widget on the Host Pool Details page for a cleaner, more intuitive look. A simplified donut chart clearly displays total spent-to-date at the center.
Autoscale: Smart Minimums Visibility in Activity Log (Jul 27)
Scale in events prevented by Smart Minimums are now clearly labeled in the Activity Feed, giving you instant visibility into when this Cost Assurance setting held back a scale down.
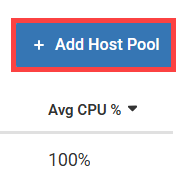
Create Host Pools End to End (Jul 21)
You can now create an AVD host pool end to end directly from the Host Pools page, from an empty pool all the way to running session hosts, without switching to the Azure portal. The new + Add Host Pool button opens a guided wizard to set up the pool, and the Create Session Hosts button lets you provision hosts immediately or at a later time. This gives you the flexibility to work in one continuous flow or in separate steps, whenever you're ready.
Host Pools Enhancements (Jul 21)
We’ve made the following enhancements to configure and manage host pools:
Import from Azure: You can now import existing AVD host pools from Azure into DaaS IQ, with discovery filters and an additive import option that preserves your existing managed pools.
Delete Host Pool: Host pool deletion is now available. Select a soft delete to remove a pool from DaaS IQ management only, or a permanent, hard delete to fully tear down its Azure resources.
Filter Session Hosts: The session hosts list now offers filtering, making it faster to find specific hosts in large pools.
Autoscale: Clearer Smart Minimum Configuration (Jul 21)
The Smart Minimums settings in the Create New Scaling Profile wizard are now clearer to understand, and prevents you from setting a Low-Usage Host Count higher than your minimum host count, including in Static provisioning. This blocks configurations that would otherwise conflict.
Session Host Configuration: Automatic Image Security Settings (Jul 6)
When you configure a session host, the Image Security Type, Secure Boot, vTPM, and Integrity Monitoring options are now automatically set based on the Image Definition you select, so the security settings always match what your image supports. This eliminates the need to configure these settings manually and prevents incompatible security combinations from being selected.
Image Details: Security and Configuration Settings Now Visible (Jul 6)
The image details page now displays the full security posture and Golden VM configuration of an image, including Security Type, Secure Boot, vTPM, Integrity Monitoring, Hyper-V Generation, Architecture, OS Disk Size, and Virtual Network Resource ID. This allows you to verify all relevant settings before using the image in a host pool.
ControlUp for VDI
See details in the Latest VDI Version release notes.
For previous versions, see ControlUp for VDI (Real-Time DX versions).
For Remote Clients, see Remote Clients Plugins.
Go to the Download Center to get this latest build for the Real-Time DX Console, Agents and Remote Clients.
Need help? Contact your support representative.
Synthetic Monitoring
New Permissions for Hives (July 15)
You can now control access to Hives with the following permissions:
Create Hive
Read Hive
Update Hive
Delete Hive
Assign Hives to Scouts: Controls whether users can select Hives when creating or editing Scouts.
You can combine the tags feature to scope these permissions, limiting users to Hives with matching tags.
Tags for Custom Hives (July 9)
You can now assign tags to Custom Hives. Use tags to organize Hives by region, environment, team, customer, or any other structure that matches your organization.
Assigned tags appear in the Tags column in the Hives table. You can also filter the Hives table by tag to find the relevant Hives more quickly.
ControlUp for Apps
App Score Thresholds (July 29)
We’ve improved the App Score experience to make scoring configuration clearer and more consistent across app groups. The scoring model itself has not changed. The thresholds are now managed in a dedicated location with a more intuitive configuration.
Previously, thresholds were configured in Employee Profiles. They are now configured under Settings > Applications > App Score. Your existing thresholds are automatically migrated to the strictest value configured for each metric, so no action is required. After migration, changes to Employee Profiles no longer affect App Scores.
We recommend reviewing the new settings to confirm that the thresholds are appropriate for all app groups.
Workflows
CrowdStrike Falcon Integration (July 30)
Workflows now supports CrowdStrike Falcon. Use the integration to search devices and detections, retrieve device and detection details, isolate devices, release device isolation, and update detection status.
ServiceNow Task Actions (July 30)
The ServiceNow integration now includes Create Task and Update Task actions. Use these actions to create and update records in ServiceNow task tables, including descriptions, states, assignments, work notes, and custom fields.
Select Returned Fields for Device Lists (July 30)
The device-listing actions for ControlUp for Desktops, ControlUp for Compliance, and Microsoft Intune now let you choose which fields are returned. Returning all fields remains the default, while selecting specific fields can reduce the response size in large environments.
Live View for Running Flows (July 30)
You can now select View details for a running flow to open a live view of its execution progress.
More Precise Flow Run Statuses (July 30)
Flow runs now report more precise statuses, such as Timed out, Terminated, and Canceled, instead of displaying an empty status.
Improvements and Fixes (July 30)
Redesigned the Tags input in the Update Tag action to make multiple tag values easier to add and review.
Added validation to Loop nodes so missing or invalid settings are identified before the flow runs.
Updated the JSON node to parse JSON enclosed in Markdown code fences, including responses returned by AI tools.
Added validation that identifies masked variables used outside HTTP Request nodes and prevents the flow from running until the configuration is corrected.
Fixed integration permission checks so users with the required edit permission can edit and save integrations, while users with view permission open them in read-only mode.
Added required-field validation for action names and URLs in the Custom Integration builder.
Flows must now have a name before they can run.
Fixed an issue that could cause a flow run to fail when a secret value was entered directly in the Authorization header of an HTTP Request node.
Dynamic Form Dropdowns (July 21)
Dropdown fields in Forms can now load options from ControlUp actions, such as List Devices and Get Custom Data. Select the provider, integration, action, and field to display, and optionally apply filters or limit the number of options.
Improved Variable Masking (July 21)
Workflows now includes new controls for managing masked variables, including a Replace value action for updating saved values. New values can be previewed before saving, and converting a masked variable back to a regular variable requires entering a new value
Improvements and Bug Fixes (Jul 21)
Accurate new-user detection: Fixed an issue that could cause returning users to be incorrectly identified as new users.
Tag multiple devices in one step: The Update Tag action now accepts multiple device IDs, allowing tags to be applied to several devices in a single step.
More reliable flow execution handling: Run now no longer saves flows without unsaved changes. Execution failures now provide clearer details, and failed start attempts appear in Run history.
Steadier canvas zoom: Zooming now remains centered on the current view, preventing nodes from moving off-screen or leaving the canvas appearing empty.
Up-to-date AI models in LLM integrations: LLM integrations now use current, supported models.
Correct handling of missing paths: Fixed an issue where references to missing paths were not resolved correctly.
Consistent dark mode: Fixed light backgrounds and low-contrast text in the Custom Integrations builder and Workflow canvas so affected panels display correctly in dark mode.
Disable Actions and Downstream Nodes (Jul 9)
You can temporarily disable an individual action or all downstream nodes while building and testing a flow. Disabled nodes are skipped when the flow runs without deleting their configuration or connections.
List Devices from Microsoft Entra ID (Jul 9)
The Microsoft Entra ID integration now includes a List Devices action for retrieving device information from Entra ID.
Pre-Fill Form Fields from URL Parameters (Jul 9)
You can now add URL parameters to a published form link to open the form with matching fields already populated. Users can review or change the values before submitting the form.
Custom Integration Support for Custom SSL Certificates (Jul 9)
Custom integrations can now connect to trusted on-premises services that use custom SSL certificates. Turn on Ignore SSL certificate when creating the integration to connect without validating the certificate.
Disabling certificate validation makes the connection less secure, so use this setting only when necessary.
ServiceNow Incident Improvements (Jul 9)
ServiceNow incident actions now provide more flexibility
Create New Incident and Update Incident support additional ServiceNow fields, including custom fields.
Get Incident can retrieve an incident by its incident number or sys_id and optionally return human-readable display values.
Update Incident sends only the fields that you provide, preserving other incident values.
Set Datadog Incident Severity (Jul 9)
The Datadog Create Incident action now includes a Severity Level field.
Improved Loop Iteration Status (Jul 9)
Loop nodes now show the status of each iteration during and after a run. Jump to first failed node opens the exact iteration where the failure occurred.
Earlier Run Tracking (Jul 9)
Runs initiated using Run workflow now appear in Run History as soon as they are initiated.
Bug Fixes (Jul 9)
Improved JSON formatting in the query editor.
Improved filtering on the Overview page.