Platform
Tenant Manager overview dashboard (April 20)
The new Overview dashboard gives you a single view across all your tenants to monitor product license utilization, product distribution, and DEX scores. You can easily view your most and least utilized tenants, with color-coded indicators to flag tenants approaching or exceeding capacity.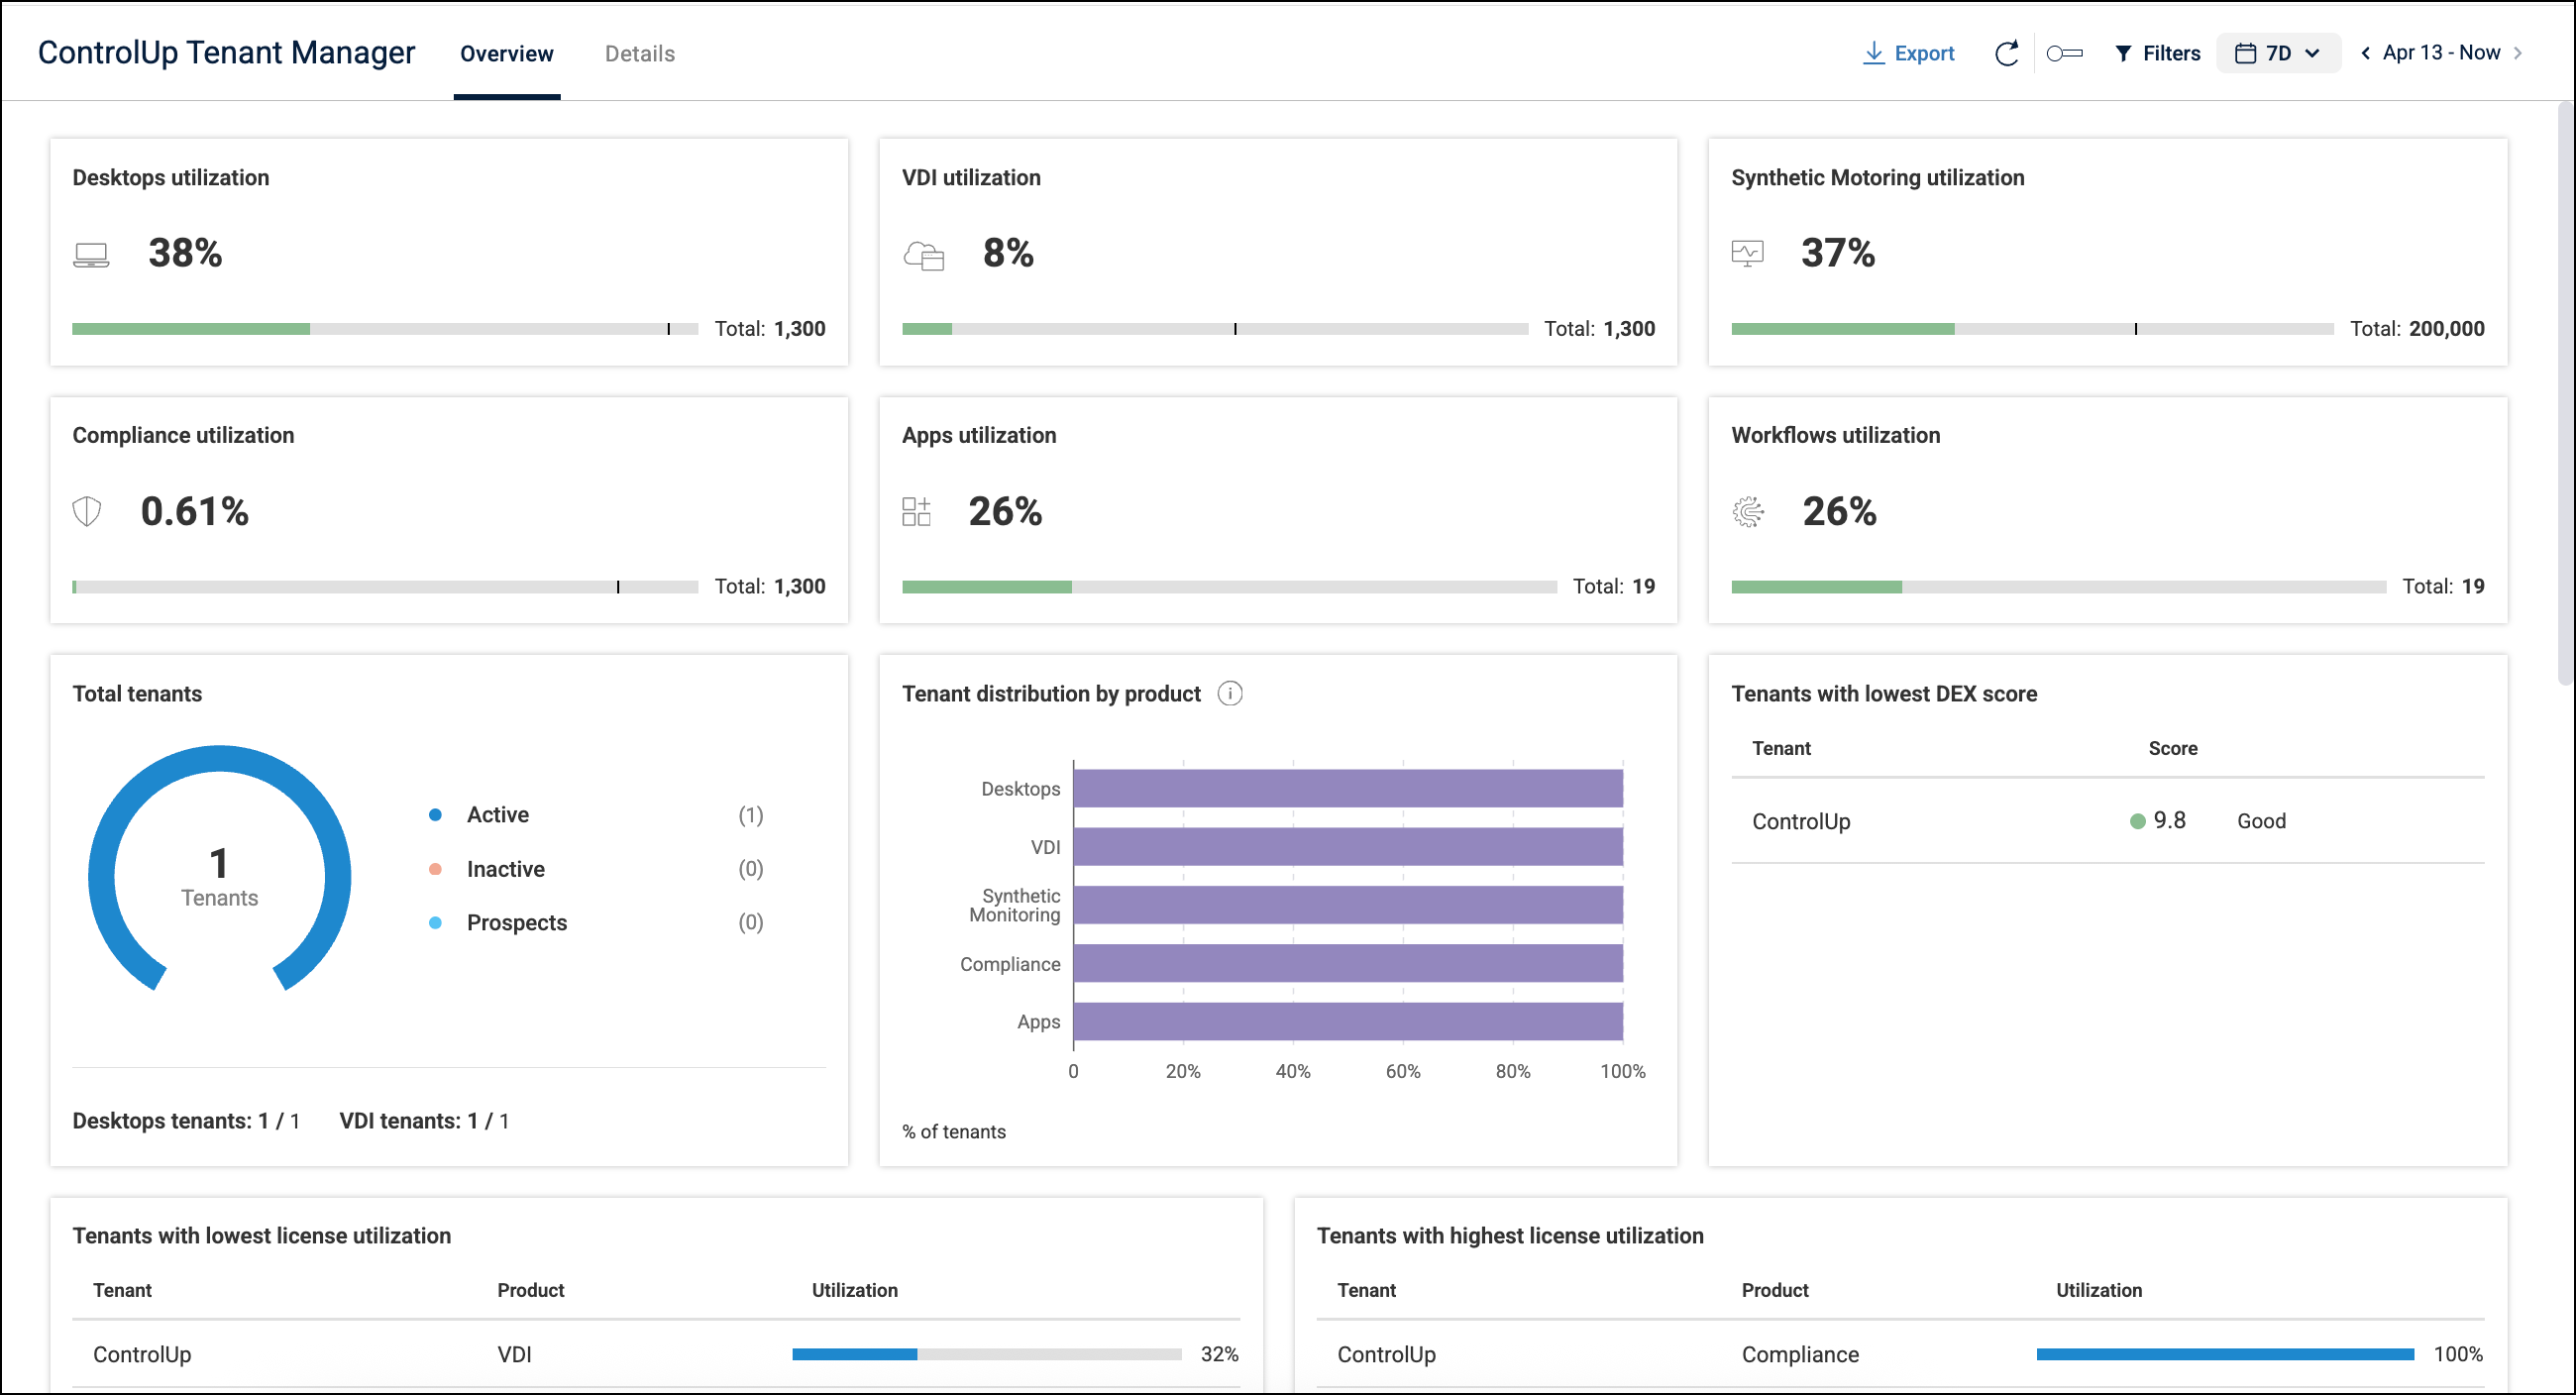
Anomaly Detection alerts now support partial editing (April 20)
You can now edit existing Anomaly Detection alerts to adjust the name, description, severity, followup Workflows, and email addresses for notifications. Detection-related fields are fixed and non-editable to preserve algorithm accuracy.
Device groups and tags added to Events details (April 7)
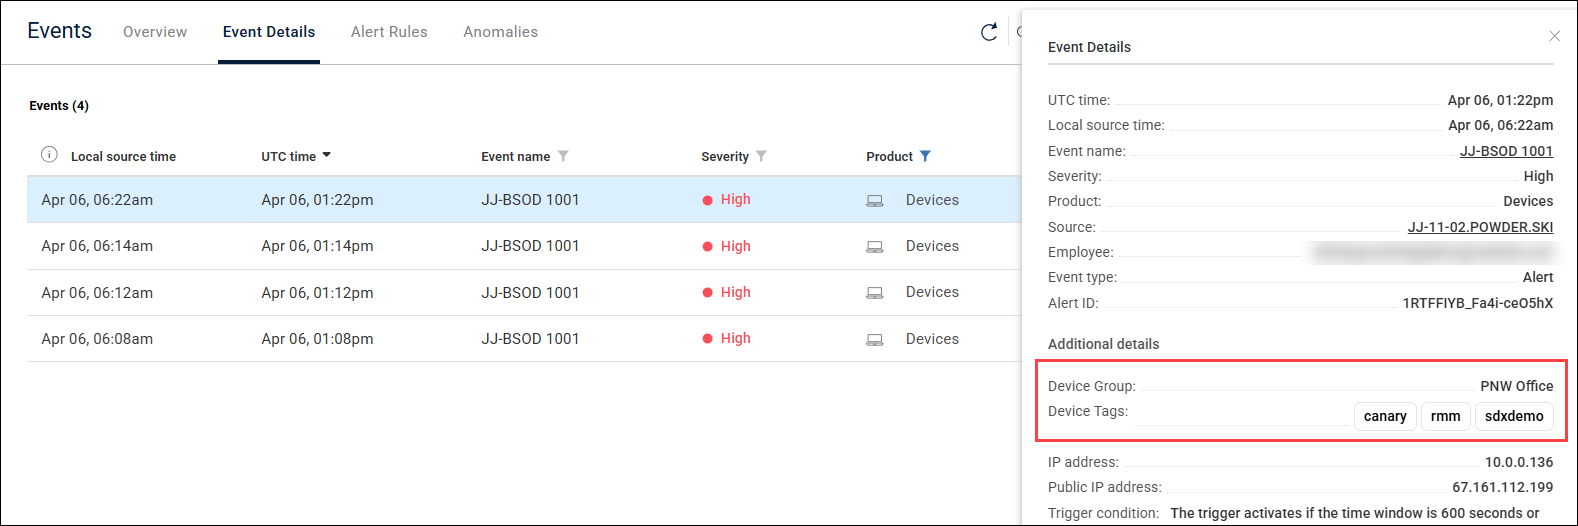
When you are viewing an alert event triggered by a device, you can now click on the event to see the group and tags associated with the device that triggered the alert.
ControlUp for Desktops
Unmanaged Remote Control sessions now include device details in the audit log (April 20)
Audit log entries for unmanaged sessions now record basic information from the controlled endpoint such as the name, OS, CPU, etc. This makes it easier to identify exactly which devices were accessed when performing audits.
Virtual Expert script suggestions now tailored to user permissions (April 20)
Virtual Expert now checks your user permissions and only suggests actions you have permission to run, preventing confusing errors when you tried to perform an unpermitted action.
Device Health & Rightsizing dashboard updates (April 7)
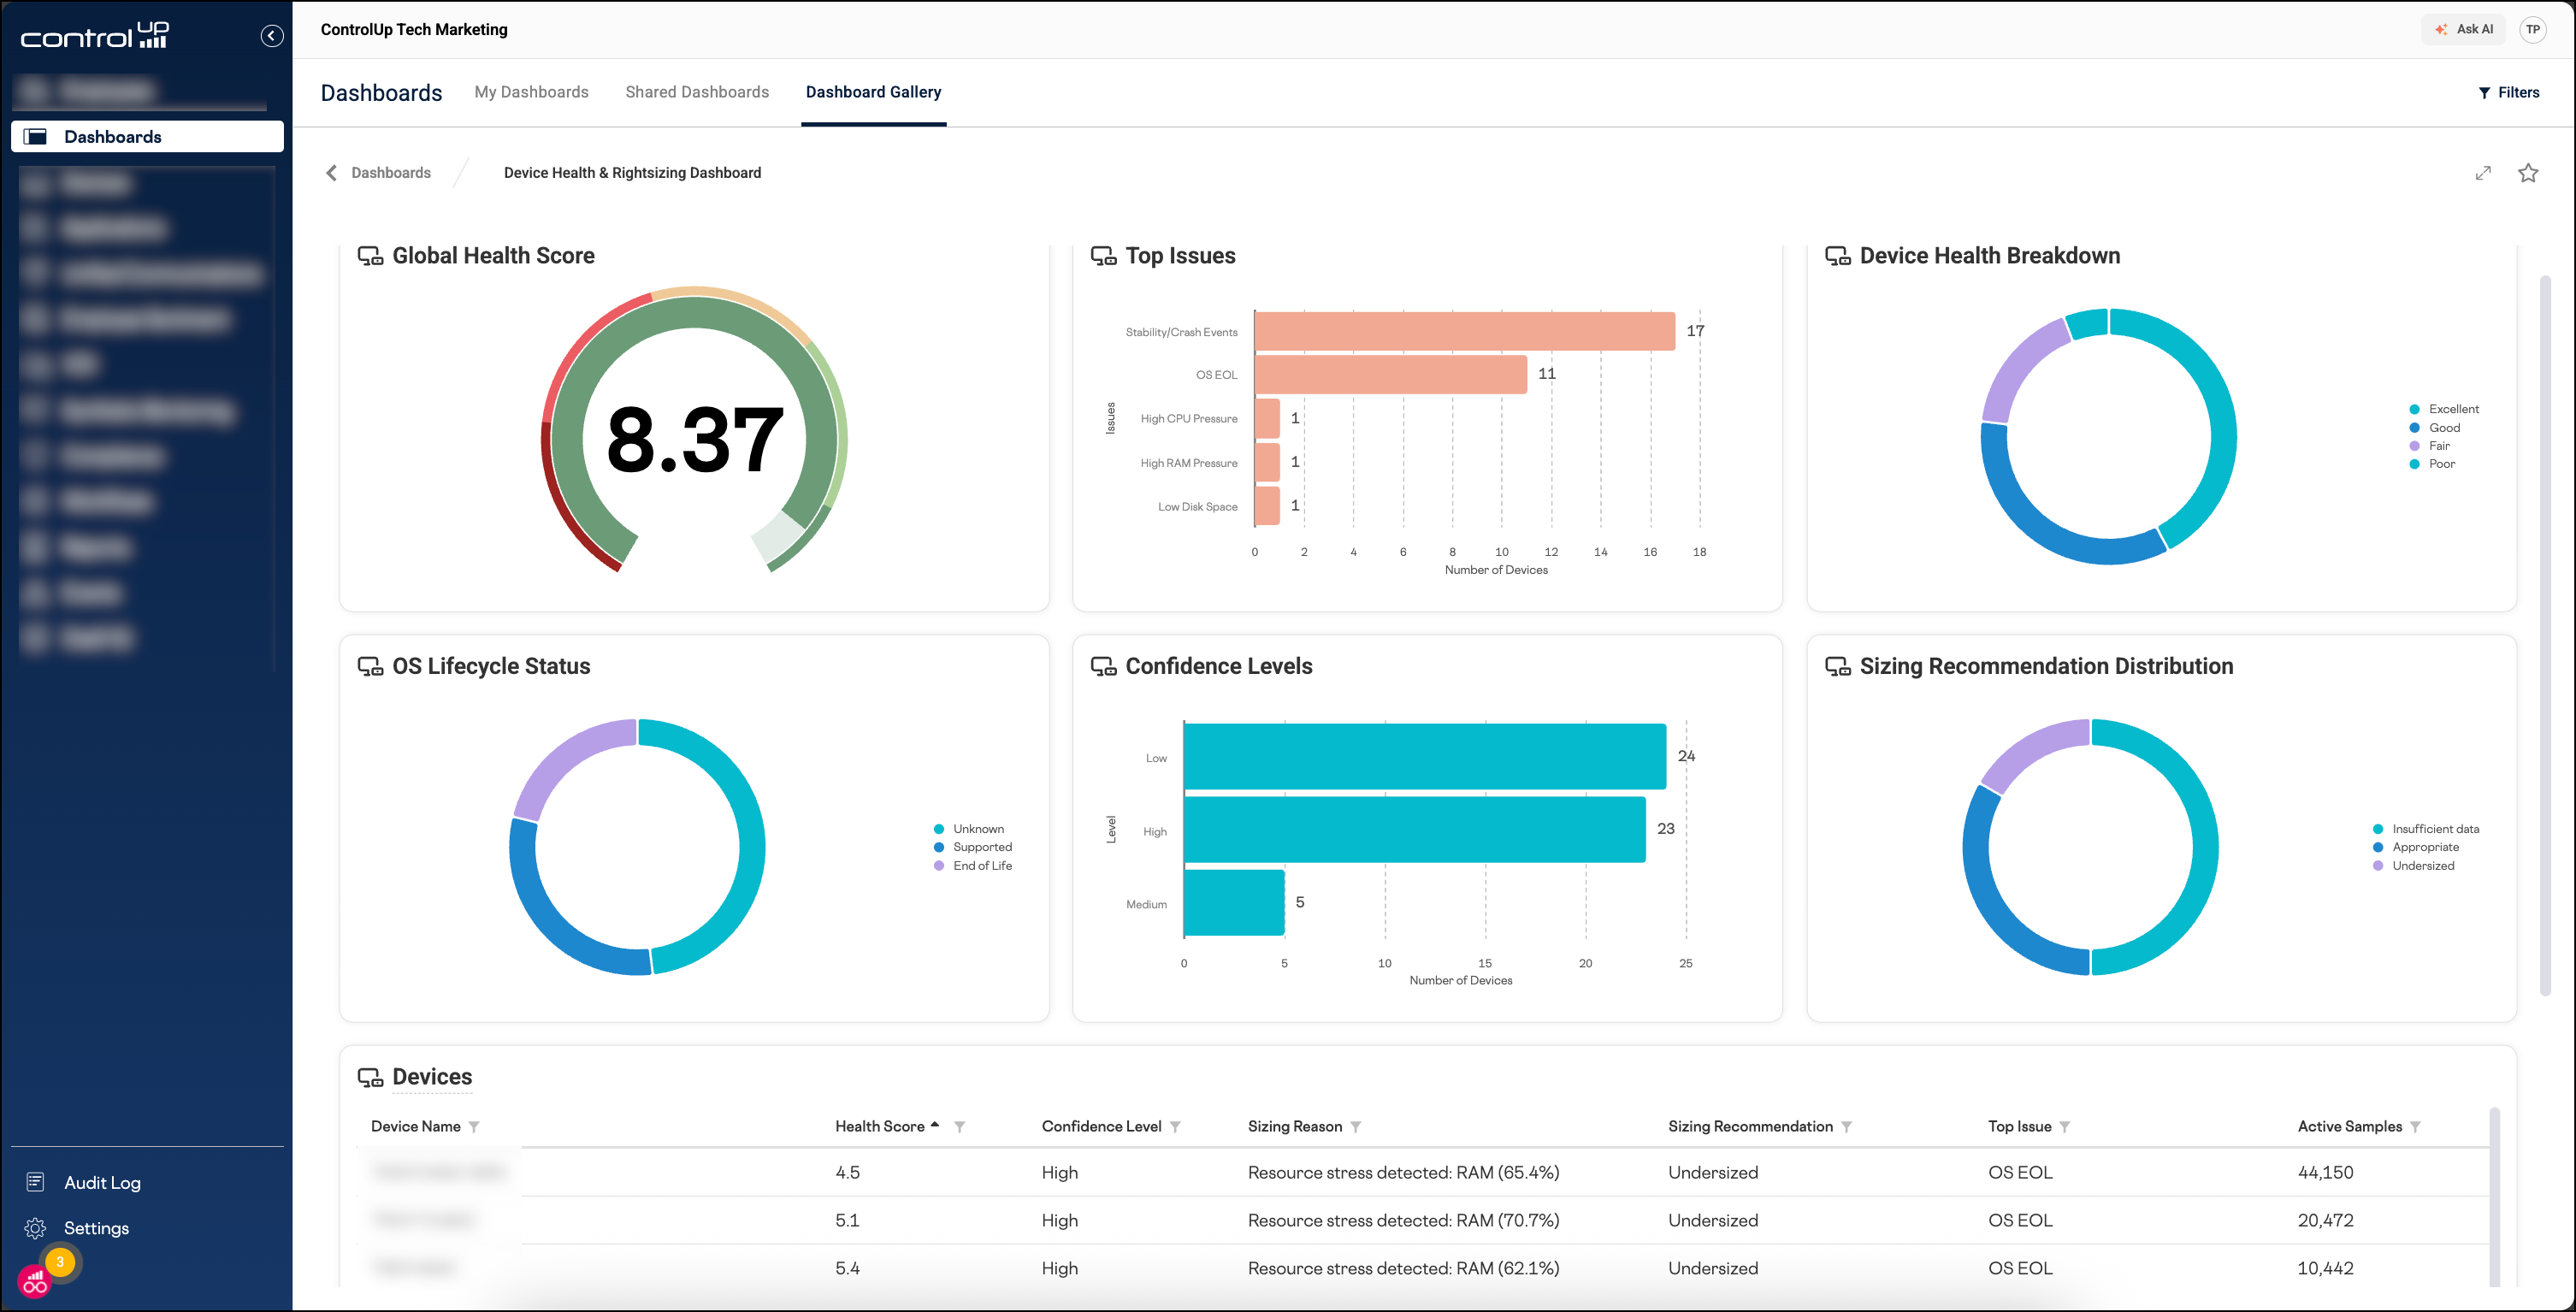
The Device Health & Rightsizing Dashboard provides actionable recommendations for hardware replacement, maintenance prioritization, and rightsizing. A health score (0.0–10.0) ranks devices and helps you identify those requiring immediate attention. You can find the dashboard under Dashboards > Dashboard Gallery.
What’s new:
Interactive widget filtering: You can now click on data within a widget to quickly filter the entire dashboard.
Device drilldown: In the Devices table at the bottom of the dashboard, you can now click on a device name to drill down into the details page for the device.
Enrich browser extension version 2.0.20 (April 7)
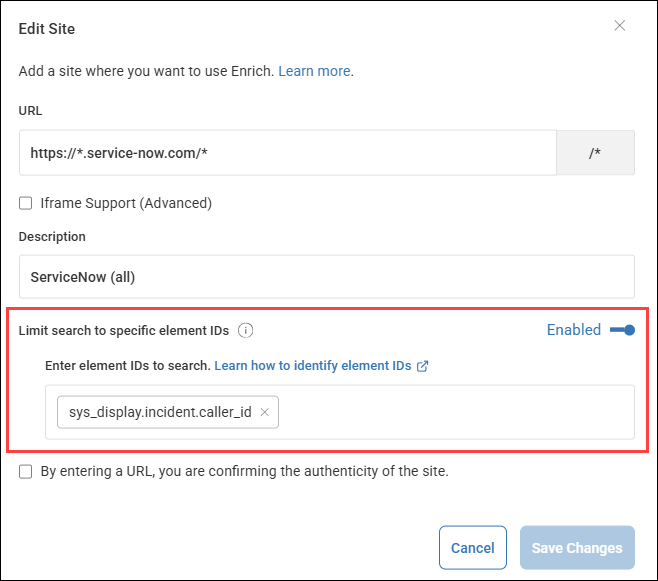
Targeted element searching: You can now optimize how Enrich searches for matching devices or users by limiting the search to specific HTML element IDs. This feature can:
Improve search precision by avoiding unnecessary matches.
Minimize browser impact by searching only specific elements instead of the entire page DOM.
To use this feature, enable Limit search to specific element IDs when configuring a supported site in the Enrich settings page, and add the element IDs to search.
ControlUp for Apps
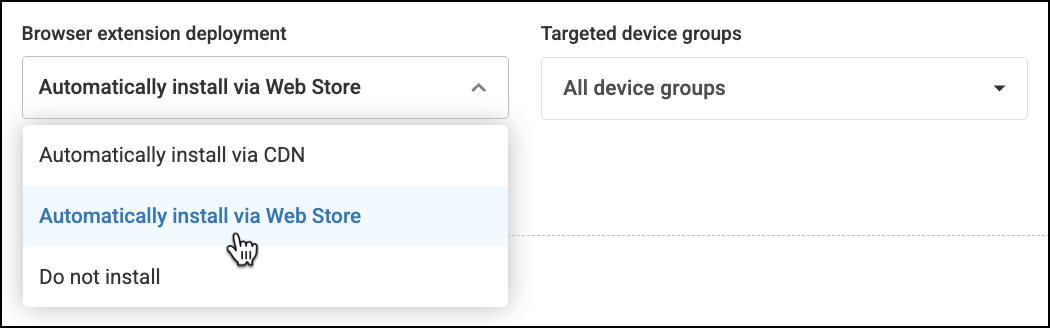
Browser extension now available for deployment via Chrome and Edge web stores (April 20)
You can now deploy the ControlUp for Applications browser extension from the official Chrome and Edge web stores. To do so, set your extension deployment settings in ControlUp to Automatically install via Web Store.
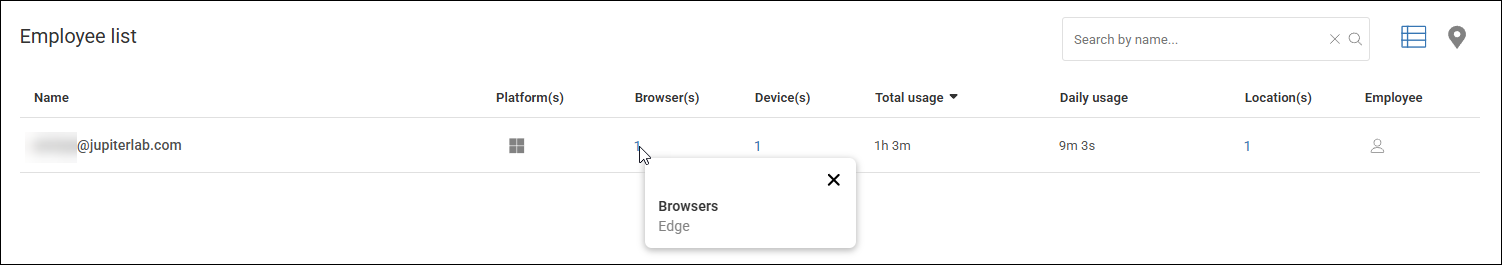
See which browsers an employee used to access an App Group (April 7)
We’ve added a Browsers column to the list of employees using an App Group. You can now identify exactly which browsers an employee used to access specific applications by navigating to the Usage tab and drilling down into an App Group.
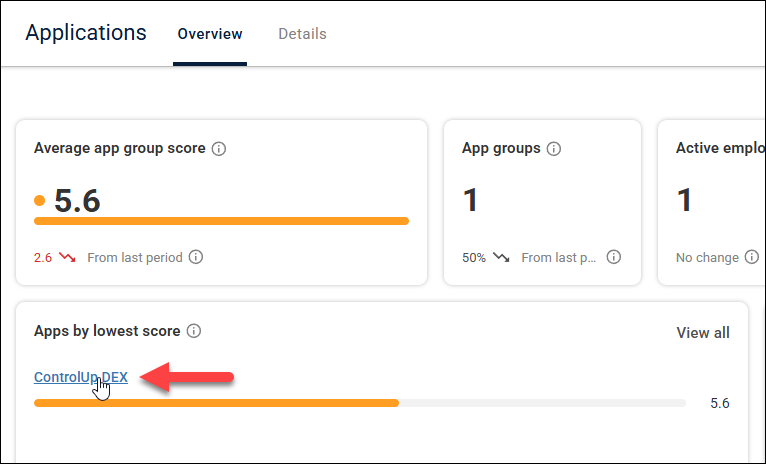
Drill down into App Groups from the Overview dashboard widgets (April 7)
On the Overview page, you can now click on an App Group from the widgets to jump straight to the detailed view for that App Group.
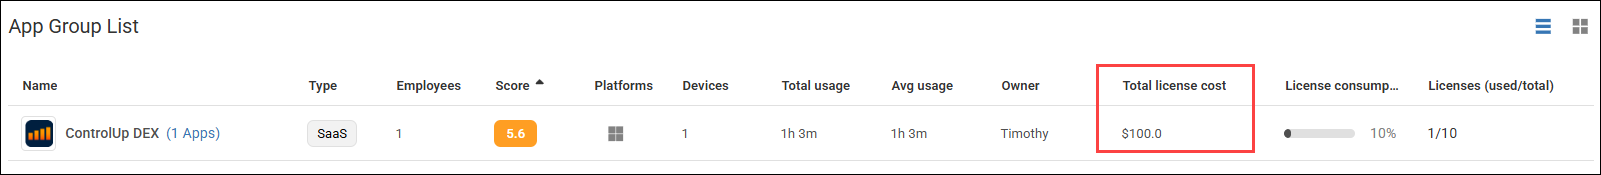
Quickly see the total license cost for your App Groups (April 7)
On the Details page, quickly see the total cost in the Total license cost column. Previously, this column displayed the individual cost per license. You can still see the cost per license by clicking Manage licenses in the three-dots menu.
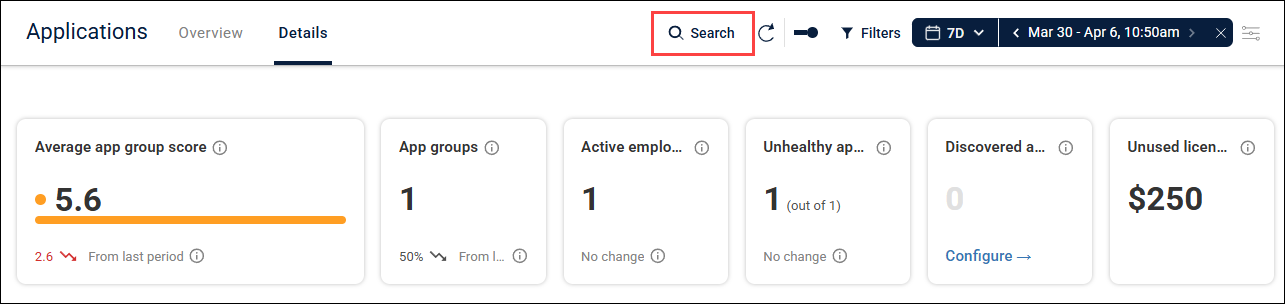
Search for and drill down into any App Group (April 7)
We’ve added a persistent search bar to the top of all Applications pages. Use it to quickly search for and drill down into any App Group.
Employees tab has moved (April 6)
On the Details page, data from the Employees tab is now merged into the Experience and Usage tabs. This makes it easier to find the data you need, with less navigation.
ControlUp DaaS IQ
Autoscale: Optional CPU and Memory Thresholds (April 20)
The CPU Threshold (%) and Memory Threshold (%) fields in your Scaling Profile configuration are now optional, allowing you to disable specific metrics by leaving them blank. This allows you to tailor your autoscale logic to focus exclusively on the performance signals relevant to your specific environment.
Image Management Enhancements (April 20)
When adding a new golden image, you can now specify an Azure Compute Gallery. This allows you to select the target gallery for the image definition.
FinOps Cost Insights
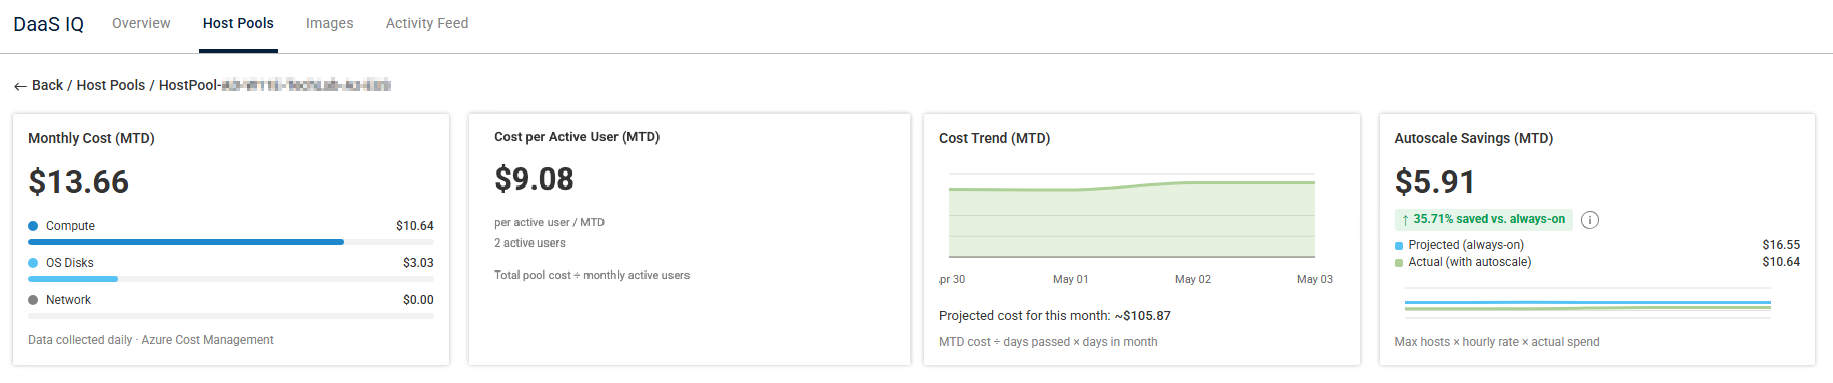
We’re adding FinOps cost-tracking widgets to the DaaS IQ Host Pools page, providing you with deep visibility into cloud spending and the financial impact of your autoscale policies. These Month-to-Date (MTD) insights help you monitor:
Monthly Cost: Total monthly compute spend per host pool, cost breakdown by resource category.
Cost per Active User: Track cost efficiency as ratio of spend to active users.
Cost Trend: Track spending trends over time.
Autoscale Savings: Compare projected compute cost to actual savings with autoscale.
Availability: We’re introducing these widgets via a gradual rollout. If not yet visible in your environment, they will appear soon.
Bug Fix
304578: Virtual Networks and subnets located in a different resource group than your AVD host pool are now imported correctly.
ControlUp for VDI
See details in the Latest VDI Version release notes.
For previous versions, see ControlUp for VDI (Real-Time DX versions).
Go to the Download Center to get this latest build for the Real-Time DX Console and Agents.
Need help? Contact your support representative.
Synthetic Monitoring
We continuously release Cloud and Custom hives. To keep your hives and scouts updated, be sure to use the latest and see what we released here:
Cloud and Custom Hive Release Notes.
Mail Application Scout (April 9)
Use the new Mail Application Scout to test if your Microsoft Exchange Online mail servers are working correctly. The Scout can alert you if your mail server is down or taking longer than expected to transmit emails.
The Scout can perform both incoming mail tests (from a ControlUp server to your mail server) and outgoing mail tests (from your mail server to a ControlUp server).
Workflows
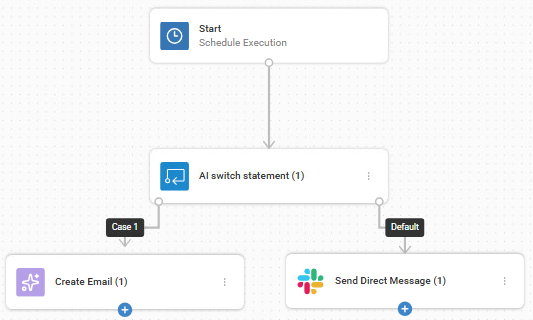
AI Switch Statement Node (April 13)
We’ve added the powerful AI switch statement node to the Flow Control nodes to function as the brain of your automation logic, providing context-aware routing for complex remediation tasks. This node evaluates natural language instructions using AI and determines which specific target branches to execute next. It ensures your flow continues exactly where you need it to.
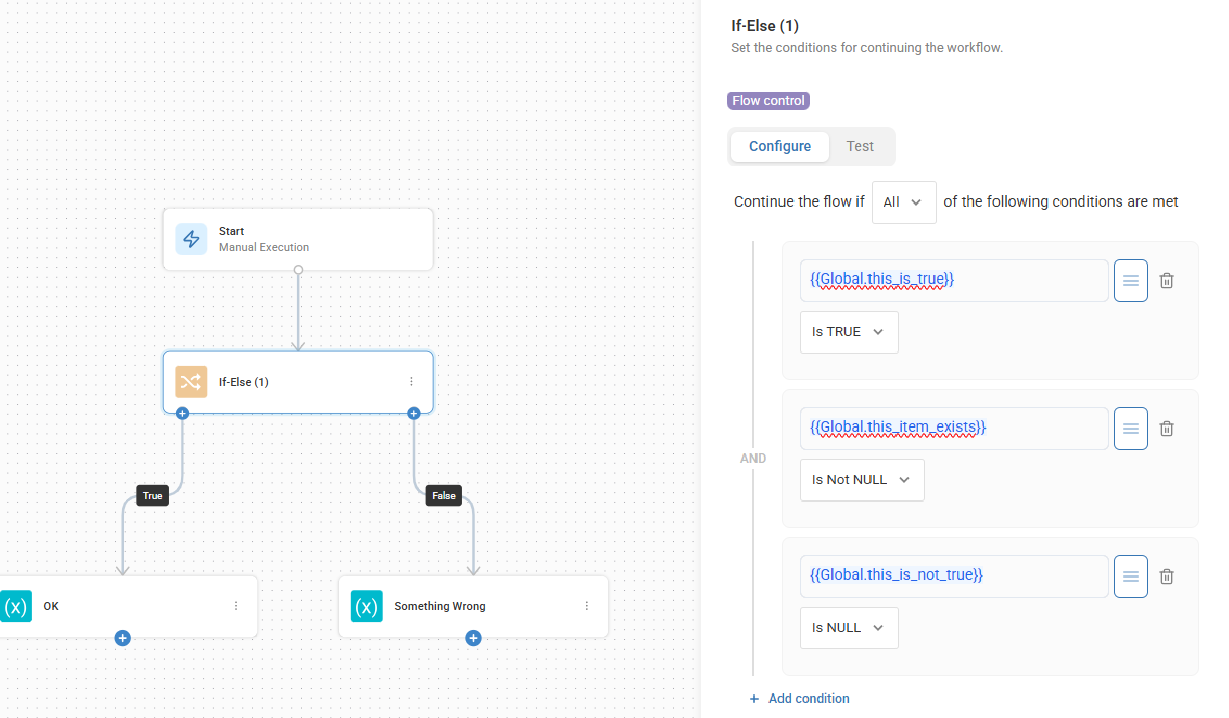
Compare With Boolean Values (April 13)
We’ve upgraded the If-Else node to provide more granular control over your automation logic. You can now filter and compare conditions using Boolean values and verify whether a specific value exists within your data stream.
Azure DevOps Listener Trigger (April 13)
We've added a new Azure DevOps Listener trigger to automatically start workflows based on real-time ADO work item updates (bugs, tasks, user stories). This simple, zero-touch method detects changes without complex network setup or outbound webhook security risks, integrating incident response and ticket-based remediation into the DevOps lifecycle.
Jira Service Desk Listener Trigger (April 13)
We've added a new Jira Service Desk Listener trigger to automatically start workflows based on real-time Jira updates (creation, status, field changes). This provides simple, zero-touch change detection without Jira webhooks, marketplace apps, or admin permissions. It integrates incident response and ticket-based remediation into your ITSM lifecycle via Jira's REST API.
Create Custom Integrations (April 13)
You can now build, publish, and share your own Custom Integrations! This feature makes it easy to save and reuse your most effective flow solutions, providing tailored support for your organization’s most complex use cases. Quickly create integrations connected to internal ticketing or private apps to ensure a consistent and secure experience across your entire platform.
New Integrations! (April 13)
GitHub: Connects to your flows to automate the management of issues, pull requests, and commits.
ManageEngine Endpoint Central: Enables flows to automate endpoint management, patch management, and inventory control.
ManageEngine ServiceDesk Plus: Enables flows to manage incidents, requests, and assets.
Relational Database: Connect PostgreSQL, MySQL, or SQL Server databases, or Oracle services, to your flows.
TeamDynamix Assets: Allows you to automate the management and lifecycle of IT inventory by enabling real-time data synchronization between your service desk and flows, with asset tracking capabilities.
XMatters: Reduce MTTR by automating the incident lifecycle from detection to resolution. Actions include triggering xMatters events and retrieving critical data for alerts, devices, and personnel, to enable seamless, automated remediation flows.
Cross-Platform Connectivity Enhancement (April 13)
We’ve streamlined your automations by enabling automatic connection between Workflows and other ControlUp products, completely removing the need for manual integration setup. Internal flow actions now interact seamlessly across the platform without consuming API credits or facing IP restrictions. This update provides access to exclusive internal capabilities, while respecting existing user permissions.
Variable Search Enhancement (April 13)
We’ve improved the variable search experience in nodes to make building and managing flows even faster. When you enter text into the variable search bar, the system now automatically searches across all available fields to instantly find the variable you need, even in large or complex flows.
Builder Canvas Usability Enhancements (April 13)
We’ve added several user experience improvements to the Workflows builder canvas to make building, managing, and running flows smoother and more intuitive.
Filters & Conditions Enhancements (April 13)
We’ve added user experience improvements in the nodes filtering and conditions UI to maintain consistent logic across all of your flows.
Dashboards
Create an Alert from a Widget (April 20)
While viewing a widget, you can now decide you want to create an alert based on the data there and go straight to creating an alert in Events Management with one click! The alert creation popup opens in Events with the basic information from the widget already entered. Just right-click a widget and select Create Alert. This feature is now available and appears only for ControlUp for Desktops widgets and data.
New Built-in VDI Dashboard (April 20)
The Big Screen Dashboard VDI is now available in the gallery of out-of-the-box dashboards. This is our first dashboard focused on VDI data, preloaded with key metrics like logon duration, CPU, RAM usage, and more.
New Filters Experience (April 20)
Filter options have moved to the top left of all dashboards and come with a fresh, more user-friendly design. Now displayed on the same line as variables, which also now has a cleaner and more consistent interface.
VDI Data Now Available in Dashboards (April 9)
You can now visualize and analyze VDI environments directly in your dashboards.
More Navigation and Display Improvements (April 9)
Improved Device Navigation: Added areas within the dashboards where clicking a device name takes you straight to the device page.
UI Refresh: A more modern look with rounded widgets, improved typography, and cleaner titles. This is the first step toward a fully modernized dashboard experience.
New & Updated Dashboards (April 9)
Including a brand new VBS Deprecation Dashboard and updates to built-in dashboards with improved click-filtering.
Fixes (April 9)
Fixed issue with empty time buckets that didn’t display any dates.
Fixed label truncation in bar and donut charts.
Improved Gallery behavior so dashboards are now added to My Dashboards by default instead of having to duplicate. You automatically receive updates to dashboards saved in My Gallery.