9.2.5
Release Date: July 22, 2026
Current Build: 9.2.5.657
To download the current build, see our ControlUp Download Center.
New Features
Monitor Omnissa Unified Access Gateway
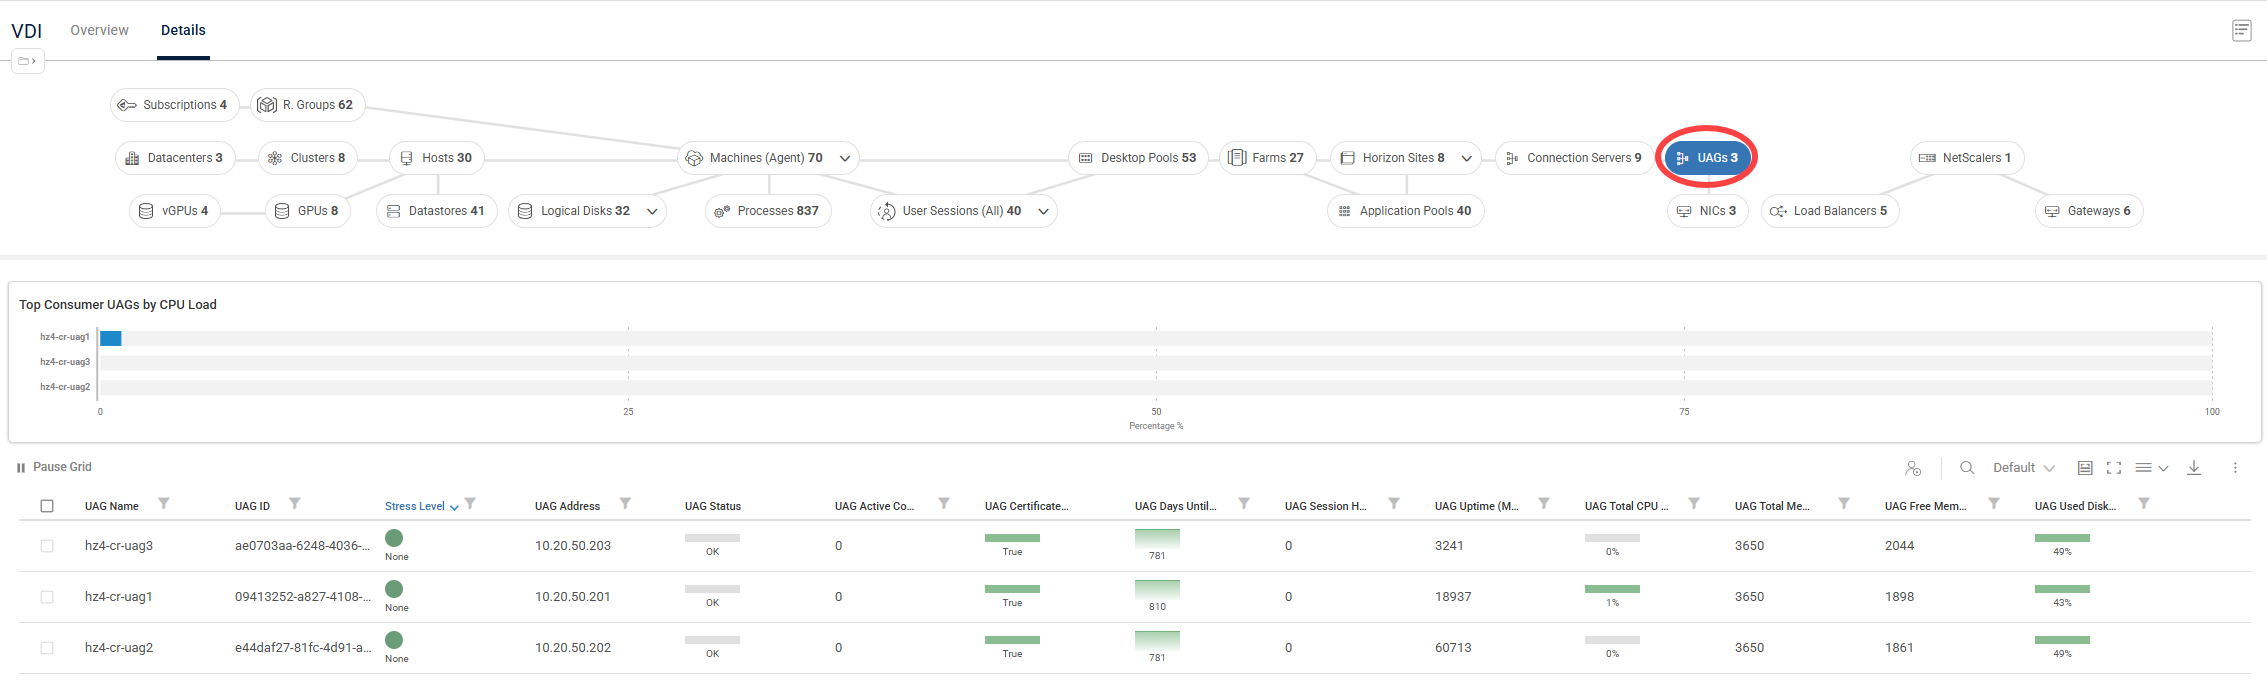
You can now use ControlUp to monitor your Omnissa Unified Access Gateway (UAG) appliances directly, eliminating the need to log into individual gateways or rely on siloed tools to track DMZ health.
UAGs metrics display critical data in the Real-Time DX Console and a new cohesive UAGs dashboard in the VDI app.
This feature includes:
Comprehensive Real-Time Metrics: Track availability, session counts, session failures, and hardware resource utilization (CPU, memory, and disk) at a glance.
Historical Data Persistence: Metrics are automatically saved to your historical database with 5-minute, 1-hour, and 1-day aggregations for seamless trend analysis.
Native ControlUp Power: UAG appliances integrate fully with native triggers, Script-Based Actions (SBAs), and RTDX, allowing you to set up proactive alerts and accelerate troubleshooting workflows.
Monitor Host GPUs
ControlUp for VDI now collects host-level metrics for physical NVIDIA GPUs and assigned vGPU profiles. We’ve added new views, widgets, and metrics to monitor the GPUs and vGPUs in your environment.
The new metrics are displayed across the VDI real-time topology in dedicated GPUs and vGPUs views, as well as in new metrics columns on the existing Hosts and Machines views grids. You can focus on a specific host or machine in the topology view (Details) or organization tree, and drill down directly to individual user sessions utilizing GPU or vGPU resources.
You can also use the new metrics to configure Stress, Scheduled, and Advanced triggers, as well as Script-based Actions, to help your organization get ahead of rising GPU costs.
Note that these features are available only for VMWare ESXi.
Monitor Windows Events
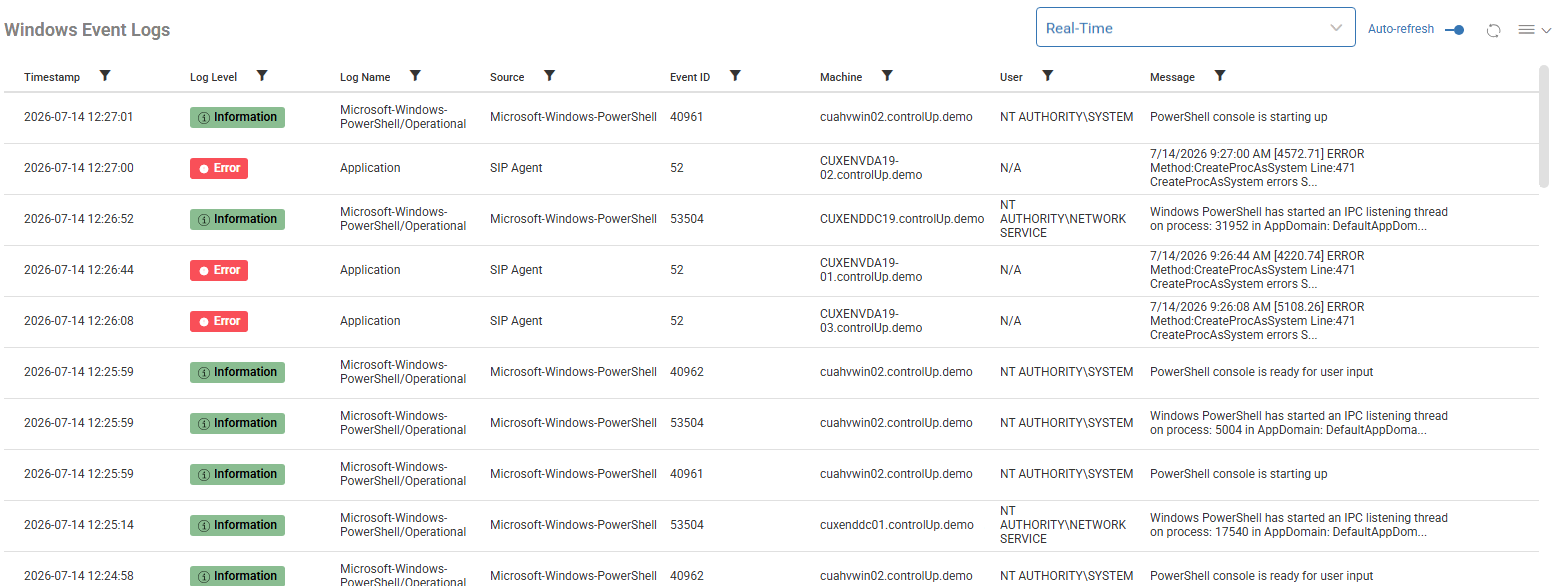
The legacy Events feature in the Real-Time DX Console is being succeeded by a scalable, rule-driven Windows Event Log Monitoring feature in DEX.
Rather than forwarding all events to the cloud, the ControlUp Agent evaluates Windows events locally against your configured rules, filtering by Log, Provider, Event ID, and Severity Level. The agent then forwards only matching events to the dashboard. This keeps data ingestion volumes and infrastructure costs predictable, while giving your team the flexibility to track any event across your environment.
Key Benefits:
Out-of-the-Box Intelligence: Ships with over 40 default rules organized by a standardized Vendor – Product – Subject naming convention (for example, Citrix - Broker - Registration Failure).
Comprehensive Coverage: Default rules monitor system health, authentication, Group Policy, Windows Update, Windows Defender, and core session lifecycles across RDS, Citrix, Omnissa, AWS, FSLogix/UPM, and Hyper-V/AVD.
Controlled Enablement: To prevent unexpected noise, the default ruleset is enabled automatically for new organizations. Existing organizations can opt in at any time.
Managed Identity for Azure
ControlUp for VDI now supports Managed Identity as a built-in alternative to standard Service Principal credentials, allowing you to configure Azure connections securely without providing a Client Secret. You can easily configure connections using either a system-assigned Managed Identity, which requires no additional IDs, or a user-assigned Managed Identity, which simply requires a client ID.
Your selected authorization method is strictly validated during setup, saved directly to the connection configuration, and seamlessly persists across all edit, reload, and update operations. Once configured, this authentication method is consistently utilized by the data collector runtime to ensure secure and uninterrupted data collection.
Azure Availability Zones
Availability zones metrics are now displayed for Azure virtual machines and disks in the Real-Time DX Console Machines and the VDI app Machines (Azure) views, providing clearer visibility into resiliency and placement. New metrics include:
AZ Logical Zones
AZ Physical Zones
New Health Metrics for Citrix Cloud Connector
From the Real-Time DX Console, you can now view all of your Cloud Connectors from any resource location.
From the VDI app, along with the common ControlUp metrics for any machine, you can view the following metrics specific to Citrix Cloud Connectors:
Cloud Connector Service Status displays the number of active Citrix Cloud Connector services currently running out of the total installed services (e.g., X/13).
Cloud Connector Stopped Service Names lists the specific Citrix Cloud Connector services that are currently stopped or missing.
Cloud Connector Stopped Services displays the total number of Citrix Cloud Connector services currently stopped on this machine.
Cloud Connector Running Services displays the total number of Citrix Cloud Connector services currently running on this machine.
Monitor FSLogix Dirty Bit Flag
The Storage > FSLogix Disks view now displays the following FSLogix Dirty Bits Flags metrics:
Dirty Bit Last Checked displays the timestamp for when the dirty bit state was last queried on the endpoint.
Dirty Bit Unknown Reason displays a translation of Win32 error code or context explaining why a definitive result could not be produced.
NTFS Dirty Bit State displays the state of the NTFS dirty bit: N/A, NotMounted/NonNTFS/Unknown, Clean, or Dirty.
Volume GUID Path displays the volume GUID used to perform the dirty bit query. Stored for traceability and troubleshooting.
Shared Credentials for Script-based Actions
You can now use Shared Credentials to configure arguments in Script-Based Actions (SBAs), reducing duplication and easing credential management across your organization’s automations.
Nutanix v4 and Prism Support
ControlUp has upgraded to the Nutanix v4 API and now supports direct connections to Prism Central, simplifying deployment within your Nutanix environment.
Known Issue
Web Interface
The preconfigured default rules might not appear the first time you open the Windows Event Log settings.
If no rules appear, click the Disable toggle (top-right), then click it again to re-enable, and refresh the page.
Bug Fixes
Real-Time DX (build 601)
282824: Built-in EUC Sync does not Crop machine Name to 15 characters (if longer than 15) and VDA Connection fails
292702: After upgrading your organization’s ControlUp Monitors, the local configuration cache loads successfully.
308158: Citrix environment EUC connections display data as expected.
310561: The NIC Usage column in the Hosts view displays “N/A” instead of “0” for Nutanix AHV hosts.
Web Interface (build 601)
305031: When you start a Remote Control session on a user device that has multiple monitors, the All Displays selector appears as expected.
306949: After upgrading your organization’s ControlUp Monitors, the Disk I/O Utilization widget doesn’t display an increase greater than expected in the Machine Trends report.
Real-Time DX (build 484)
295547: When you connect to a Citrix session from a Dell ThinOS thin client, the client device name displays correctly in the Sessions view.
275879: When you connect to an AVD session from a Windows App client, the client IP address (oClientIP) displays correctly in the Sessions view.
9.2
Release Date: May 13, 2026
Current build: 9.2.0.733
New Features
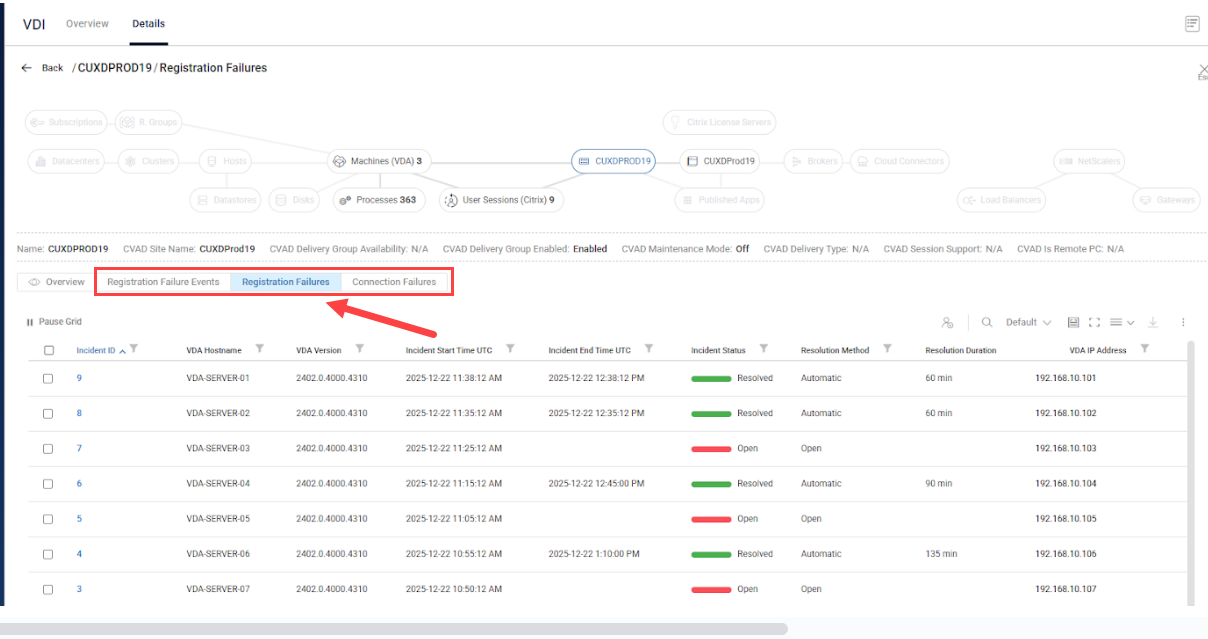
Citrix VDA Registration State Monitoring
Improve your organization's monitoring capabilities with real-time visibility into Citrix VDA registration health. Instantly detect failures, track incidents from start to resolution, and access rich diagnostics to troubleshoot faster and minimize downtime. The Citrix VDA Registration State Monitoring feature collects and correlates registration events from VDAs and Delivery Controllers for complete visibility into your on‑premises CVAD and Citrix Cloud (DaaS) environments.
What It Does
Dual-Source Event Collection
Monitors 14 VDA event types in real time from the Citrix Desktop Service.
Monitors 30+ DDC event types from Citrix Broker Service and Broker Monitor.
Automated Incident Management
Automatically creates incidents when registration failures are detected.
Tracks incident lifecycle: Open → Closed/Resolved.
Calculates resolution duration for SLA reporting.
Rich Diagnostic Data
Captures 30+ deregistration reason codes with clear descriptions and recommended actions.
Associates failures with Delivery Groups, Machine Catalogs, and Citrix Sites.
Preserves full event payloads for deep-dive analysis.
Citrix User Connection Failure Monitoring
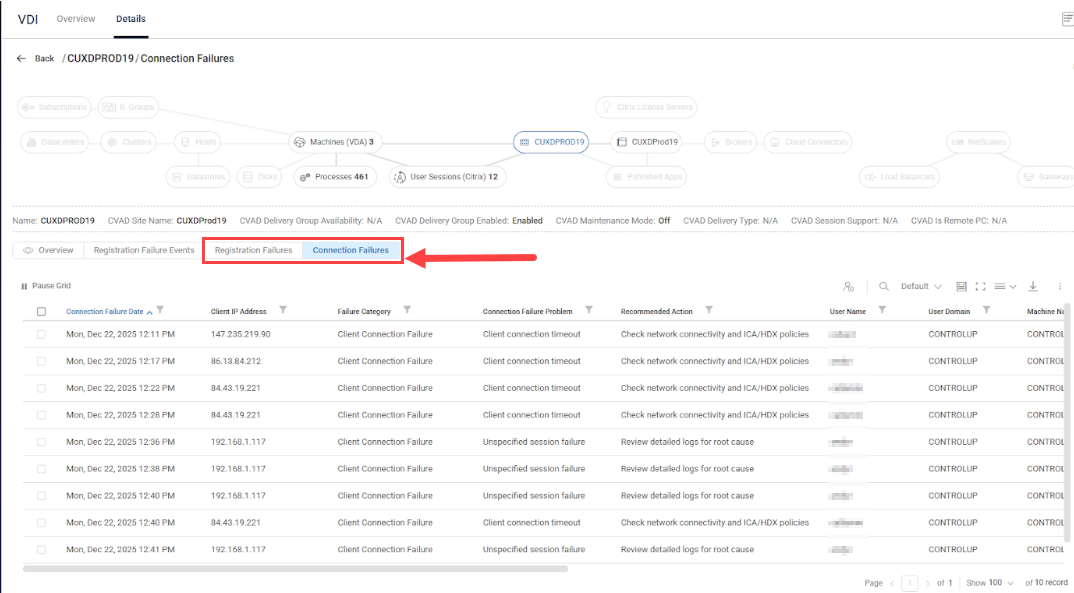
Quickly identify and resolve Citrix user connection failures. Get clear failure reasons, user context, and recommended actions to keep users connected and productive. The Citrix User Connection Failure Monitoring feature offers real-time diagnostics of user connection failures captured directly from the Citrix Broker. It provides quick identification to accelerate troubleshooting and improve the end user experience in your on‑premises CVAD and Citrix Cloud (DaaS) environments.
What It Does
Comprehensive Failure Capture
Monitors all session launch failures in real time from the Citrix Broker.
Captures 27+ distinct failure reason codes with clear descriptions and recommended actions.
Categorizes failures into 6 high-level categories for quick triage.
Rich Diagnostic Data
Connection path: Connected via hostname/IP, launched via hostname/IP, protocol.
Machine state: Registration state, power state, fault state, maintenance mode, VDA version.
Session timing: Brokering duration, VM start, profile load, GPO processing, HDX initialization timestamps.
Citrix Black Hole Monitoring
Version 9.2 enhances Black Hole Monitoring with new VDA machine metrics. This feature automatically detects “black hole” VDAs (machines available to the broker but failing user connections), enabling quick identification and resolution before user impact. You can configure triggers on black hole failure metrics using stress level or machine down filter conditions.
New metrics include:
Black Hole Failed Attempts Count: Number of failed connection attempts for this VDA within the black hole detection time interval.
Black Hole Status Change Time: The last time when black hole status was changed.
Is Black Hole Detected: Indicates whether VDA is identified as black hole.
Windows Process Relationship Monitoring
The Processes view in the Real-Time DX Console now displays deeper insight into process hierarchies by displaying parent process details for each running process. New metrics make it easier to trace how processes were launched and understand their relationships.
New metrics include:
Parent PID: Process ID of the parent process that created this process.
Parent Process: Name of the parent process that created this process.
Process Tree Depth: Number of parent processes up to the root process (0 for root processes).
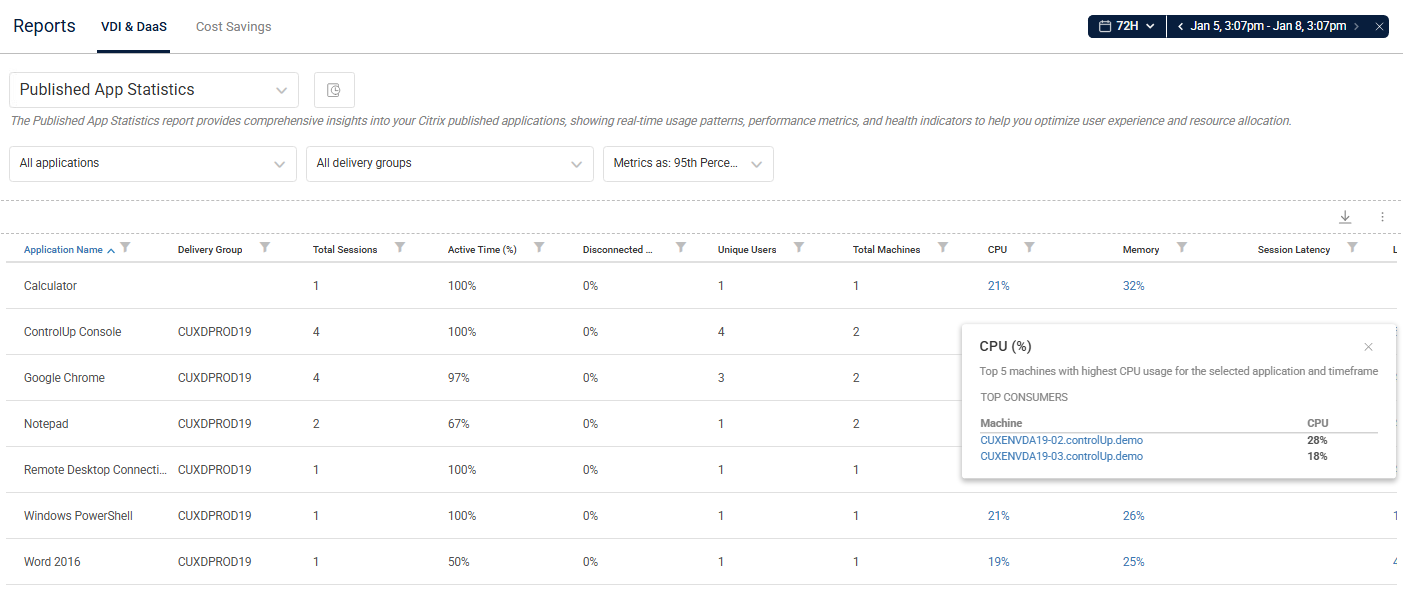
Published App Statistics Report
We added the Published App Statistics report to provide comprehensive insights into your Citrix published applications, including real-time usage patterns, performance metrics, and health indicators to help optimize user experience and resource allocation.
This report provides:
Performance metrics for all Citrix published apps launched via connected Citrix Cloud and CVAD connectors within the selected timeframe.
Deeper metric drilldowns to isolate top resource consumers.
Analyzation of latency and load with Average, P95, and P99 selectors.
Identification of Citrix host bottlenecks.
New Citrix Reports
We added the following new Citrix reports to view historical metrics:
Citrix Registration State report: Displays Citrix VDA machine registration state changes.
Citrix Connection Failures report: Displays Citrix registration and connection failures.
New ControlUp Agent Version Metric
We added a new ControlUp Agent Version metric to the Machines view in the Real-Time DX Console. This column shows the installed ControlUp Agent version for each endpoint, giving you immediate visibility to validate upgrades and identify incompatible versions—without remoting into machines.
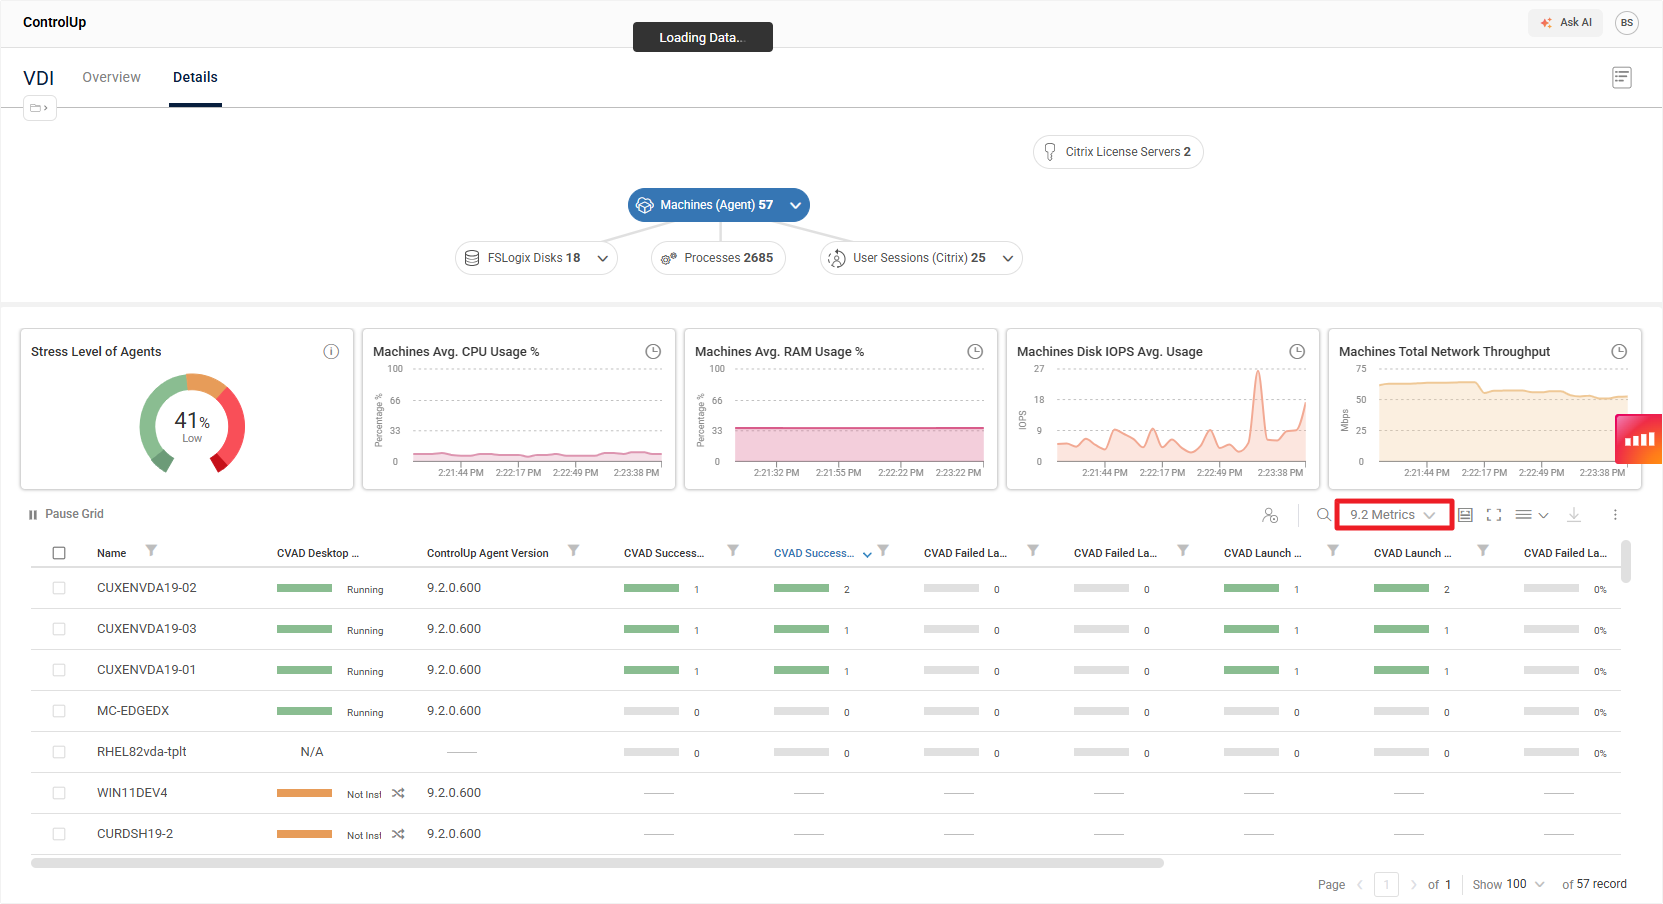
New Version-Specific Presets
To help you quickly identify metrics introduced in previous versions, we've added dedicated "9.2 Metrics" presets to every view that includes at least one new version 9.2 metric. These presets give you a focused look at exactly which metrics are new in this version.
Customize Script-Based Action (SBA) Logon Types
You can now customize the Windows logon type used when executing Script-Based Actions (SBAs). This provides greater flexibility for environments with specific security policies or execution requirements. You can configure this setting via the registry on a machine where the ControlUp Agent is installed.
Improved XenServer Secure Connectivity
We’ve streamlined the connection process for XenServer 8.4 by introducing native HTTPS support. Previously, enabling secure communications required a manual registry configuration on each data collector. We removed this requirement, providing a production-ready experience immediately upon installation. Now, the system automatically detects and utilizes HTTPS, ensuring your data is secure by default.
Trigger & Alerting Across All Features
Configure triggers and automated actions for any event or incident—email, webhooks, scripts, and more.
Streamlined Experience: Moving Features to DEX
To deliver a more unified and modern experience, we’ve transitioned several functionalities from the Real-Time DX Console to our DEX platform. These changes ensure better performance, centralized management, and an improved workflow for your team.
Citrix License Activation Service Support (available from build 711)
We introduced support for the Citrix License Activation Service (LAS) to ensure uninterrupted visibility of your license pool data as legacy WMI-based services are retired. ControlUp Agents now retrieve Citrix license metrics directly from local license files, providing accurate reporting in the Real-Time DX Console Citrix Licenses view for all LAS-enabled servers.
What’s New:
Licensing Management
We’ve deprecated ControlUp Licensing from the Console. All ControlUp product licenses are now activated and managed in DEX for a simplified, centralized process.
Incident Management
We’ve deprecated the Incidents pane from the Console. You can now manage all Windows Event Viewer incidents directly from the Events dashboard in DEX, giving you a more powerful way to track and manage incidents across your organization.
Monitoring and Remediation Settings (Implemented for versions 9.1.5 and higher)
We’ve added a new setting to the DEX Platform settings for you to Enable Automatic Monitor Remediation. This is enabled by default. To access, go to DEX Settings > VDI.
When enabled ControlUp support can perform remote actions on your monitors and agents, including restarting services and collecting diagnostic data such as log level changes and memory dumps. Uncheck this option to opt out and disable remote actions by ControlUp.
Bug Fixes
Real-Time DX (build 733)
305527: The CPU Speed metric in the Hosts view displays data correctly after restarting a XenServer host.
306201: AVD user sessions display as expected in the Sessions view.
Real-Time DX (build 711)
246744: User sessions on CVAD application servers no longer display “N/A” for all logon metrics.
293000: The Uptime metric for XenServer hosts successfully updates if the host shuts down.
293323: Non-persistent environments display Latency and Bandwidth metrics values as expected.
293710: Alerts trigger successfully.
294416: Search Machines filter works as expected in the Machines view.
301825: All ControlUp Agent executables and DLL files are properly signed as expected.
303032: Event ID 401 warning messages no longer appear during ControlUp Agent startup.
Web Interface (build 711)
295330: Avg. Logon Duration metrics display as expected in the Resource Groups topology view.
Real-Time DX (build 622)
206095: XenServer host uptime metrics update accurately as expected when a host is offline.
285894: Importing a Script-based Action (SBA) no longer fails due to an index out of range.
285901: Launching the Console no longer triggers errors in the log files due to missing SBA security items. The import process now automatically handles these scenarios by inserting missing items.
285904: The Set-CUPartitions PowerShell cmdlet partitions selected records as expected.
292500: Omnissa Horizon connections are added properly to your organization tree when pods architecture is detected.
293297: Fixed an issue where corrupted triggers with null or empty names could block users from logging into the Console. The system now automatically identifies and bypasses these invalid entries
294328: Fixed an issue where high volumes of session events could bypass specific trigger columns during the routing process. This fix ensures that even during periods of excessive session activity, your event-based triggers and automations remain accurate and reliable.
Web Interface (build 622)
251163: The Published Apps Usage Details report displays the correct End Time and Total Duration for user sessions in the Instance Breakdown popup.
291008: Fixed an issue in desktop group GUID generation that could lead to DNS mismatches during failover scenarios. The system now exclusively uses the configured connection URL to generate GUIDs.
Real-Time DX (build 600)
286314: XenServer 8.4 connection no longer crashes in the console.
Web Interface (build 596)
282554: The User Sessions (Horizon) widget count displayed matches the data grid records count in the Details > User Sessions (Horizon) view.
Real-Time DX (build 507)
287131: If you install a ControlUp Monitor using the ControlUp.Automation PowerShell module, it no longer throws an “OutboundExtensionException” error for the AVD data collector agent.
273787: Cloned Citrix PVS machines no longer throw the error “Object reference not set to an instance of an object” in the Console after startup. Machines cloned from a golden image now connect as expected.
286895: vCPUs Runnable metrics display correct and current values.
288946: If a ConnectionFailureLog record includes a null UserId, deserialization no longer fails.
Web Interface (build 507)
288903: The CVAD Last Successful Data Collection metric displays updated data as expected in the Details > Citrix Sites view.
Real-Time DX (build 432)
269602: Shared credentials are saved as expected when using Independent Sites mode.
272380: The services.exe process no longer consumes higher CPU than expected after upgrading the ControlUp Agent to the latest version.
Web Interface (build 432)
282313: All Citrix delivery groups display properly in the Details view.
Known Issue
The AVD user email field is not yet available in the Session Activity report, but it will be included in a future release.
9.1.5
Deprecation of Console Licensing Activation
We’ve deprecated the ability to activate ControlUp for VDI licenses from the Real-Time DX Console. Going forward, you must activate all ControlUp product licenses from our DEX platform. For details, see here.
Released: December 29, 2025
Current build: 9.1.5.445
New features
New Citrix Session Startup Metrics
The ControlUp Agent now collects Citrix End User Experience Monitoring (EUEM) metrics during session initialization and reconnection events. These metrics provide visibility into the client-side session startup phases, including launch page loading time, ICA file download duration, name resolution, and session creation time. This data helps administrators identify bottlenecks in the Citrix session startup process and improve end-user experience.
Omnissa Horizon Migration to REST API
We migrated the Omnissa Horizon Server from SOAP to REST API to streamline ControlUp's data collection process. Our Horizon data collection module now uses Omnissa’s REST APIs instead of the SOAP-based View API. We integrated load balancing and throttling to ensure faster performance and data integrity, enabling you to more effectively troubleshoot issues and maintain your Horizon environment.
Note that ControlUp only supports the REST API from Omnissa Horizon version 2406.
Breakdown Citrix Cloud Connections
You can now assign specific delivery groups to each connection to improve data collection granularity. This feature is not supported if your environment is deployed with independent monitor sites.
Performance Improvements in the Web UI
We’ve improved the queries for gathering monitoring data when accessing from the web UI in app.controlup.com. Large organizations will see an improvement in loading time.
Bug Fixes
Real-Time DX
280888: Improved fault tolerance for fetching NIC information from managed machines.
282313: Delivery groups appear as expected in the Citrix Cloud data collection.
275533: Memory leak in the ConnectionError field no longer caused by duplicate property getter registrations, and improved aggregation logic to properly handle semi-colon separated values.
275088: Updated Citrix XenDesktop monitoring libraries to add HTTPS support for CVAD (Citrix Virtual Apps and Desktops) connections.
270710: Drilling down from the Clusters topology in DEX VDI Details view successfully displays machines with correct node role retrieval logic.
272764: Monitors no longer try to verify expired JSON Web Tokens more times than expected.
270998: The Console successfully connects to Citrix Cloud EUC environments.
267233: Monitors no longer consume higher RAM than expected.
269592: The cuAgent.exe process data appears as expected.
268410: The Agent MSI is signed as expected.
267023: Monitors can resume streaming data even if the schema load fails.
266144: The Console no longer reports multiple repetitive errors on parsing LDAP filters.
253816: Remote Clients Microsoft plugin tries to open virtual channels as expected.
268918: The cuAgentHelper.exe process no longer causes the ServiceHost Local Session Manager service to consume higher CPU than expected.
255555: The function “GetCaptionByOSLanguage()” no longer breaks the VM count collection.
249077: Performance monitor counter errors no longer cause the ControlUp Agent to crash.
241990: Monitors no longer consume higher RAM than expected due to Agent status issues.
235111: When you add a new Azure Cloud connection in the Console, the VM appears as expected under Cloud Connections > AZ > Machines.
258273: Breakdown Citrix Cloud: Exclusion filters properly exclude delivery groups that match their comma-separated wildcard patterns.
257028: The agent authentication key imports successfully to the agent deployment settings object.
256275: If you drill down from a machine, the Sessions view opens as expected for the selected machine.
258003: The cuAgent installs successfully and remains active unless you manually uninstall it.
223815: The cuAgentHelper.exe process starts successfully without throwing the error: “Illegal characters in path.”
253221: You can successfully connect Citrix EUC connections to independent sites with site credentials.
254620: Independent sites credentials are properly synced in the Console.
241990: Monitors don’t consume higher RAM than expected.
236417: You can successfully save a trigger if you enter regular expressions (RegEx) in the filter.
251151: You can successfully add a CVAD version 2411 EUC connection in the Console.
252848: You can now add and duplicate trigger templates after upgrading to the latest version.
253606: The Virtual Machine count is collected correctly for all OS languages.
248908: Triggers are saved in the Console as expected and not removed automatically.
253139: The HZ Available Farms column displays accurate data in the Console grid.
241634: ControlUp Agents no longer consume higher CPU than expected when the event queue reaches its limit.
245319: If you select the Enable built-in synchronization option in Connection Settings, machines are added to folders as expected.
247835: Triggers containing tags run properly.
247943: The cuAgent doesn’t consume higher CPU than expected.
248498: Built-in folder synchronization successfully moves machines to the folders you select.
248567: You add more than two instances of the same Azure cloud connections using either the Console or the Add-CUCloudConnection PowerShell cmdlet.
242870: Citrix Cloud applications display correctly for the selected Delivery Groups in your organization tree and the Applications view.
250145: Console login successful after upgrading to version 9.1.0.
250755: The Console successfully connects to Horizon EUC environment connections.
250956: You can successfully create events from Advanced Service triggers in the Console.
251676: The Add Template popup opens with prefilled values as expected.
253027: You can successfully add Horizon EUC connections to ControlUp Monitors with the Add-AddHorizonEUCConnection PowerShell cmdlet.
253028: Users can’t successfully execute actions with PowerShell cmdlets without being granted the proper Security Policy permissions.
256361: The Install-CUMonitor PowerShell cmdlet requires an Advanced Authentication certificate to successfully run.
Web Interface
263977: Monitors are listed as expected throughout the VDI App.
261400: The Published Apps count matches the record count in the data grid.
237684: The Machines (VDA) count matches the Total VDAs widget count in the Machines (All) view.
238842: Citrix licenses appear correctly in the Citrix License Usage report as they do in the Console Citrix Licenses view.
253951: Actions that you execute successfully in the VDI App return a “Success” response.
244891: Password changes for shared credentials in the Console appear as events in the VDI and DaaS Audit Log.
237684: In the Machines (All) topology, the VDA count in the Total VDAs widget matches the VDA count in the Machines (VDA) topology.
241982: In the User Sessions topology, the Home icon appears as expected in the Client Device Score column.
Known Issues
264016: You must use a data collector to monitor Horizon; if not some metrics may not appear correctly, including Horizon Pool ID and HZ Farm Enabled.
When monitoring Horizon version 2503, the host name and memory for the host may not be available. This is due to a bug in the Horizon API for version 2503.
9.1
Released: August 17, 2025
Current build: 9.1.0.807
New features
Monitor Independent Sites
ControlUp Monitor sites can now operate independently from one another, eliminating their reliance on a single Master Monitor. If you monitor a large organization or MSP, you can divide your main monitor site into smaller, self-sufficient sites that work independently to enhance scalability, stability, and fault tolerance.
Shared Credentials
You can assign permissions for shared credentials to specific users, and assign specific credentials to specific security roles.
Cloud Connection Enhancements
To achieve the best data collection performance in your environment, you can utilize data collectors closer to your virtual endpoints.
Breakdown Azure Cloud Connections
You can now create multiple Azure connections for the same subscription using either PowerShell cmdlets or the Real-Time DX Console. Assign specific resource groups to each connection to improve data collection granularity.
Breakdown Citrix Cloud Connections (available from build 9.1.0.807)
The new Citrix Cloud Connection Breakdown feature enables you to split large Citrix Cloud connections into logical groups by applying inclusion and exclusion filters to Delivery Groups. This allows multiple connections to the same Citrix Cloud tenant, with each connection displaying only the Delivery Groups and its data that match its configured filter rules using wildcard or regex patterns. The feature is particularly valuable for enterprises managing multiple teams, regions, or business units within a single Citrix Cloud environment, providing granular visibility and management control without requiring separate Citrix Cloud instances
New Reconnect Metrics (available from build 9.1.0.807)
ControlUp now provides comprehensive visibility into Citrix session reconnection performance with new metrics that track every phase of the reconnect process, from initial client startup through Windows processing to final connection establishment. These metrics include detailed timing for:
ICA File Download Duration
Last Reconnect Time
Name Resolution Web Server Duration
Session Creation Client Duration
Session Lookup Client Duration
Session Startup Client Duration
Total Reconnect Time
Windows Reconnect Processing Time
IT teams can now identify reconnection bottlenecks, optimize user experience during session reconnects, and proactively address performance issues affecting users returning to disconnected sessions.
Two New Metrics in Citrix Connection Failure Log Table (available from build 9.1.0.807)
ControlUp 9.1 introduces comprehensive monitoring of Citrix user connection failures through a new monitor table that enables programmatic querying and analysis of failed connection attempts. Starting with version 9.1.0.807, this capability is enhanced with two additional metrics: the Client IP Address identifying the endpoint experiencing connection failures, and the associated Branch location based on your configured IP-to-branch mappings. These enhancements provide IT teams with immediate visibility into which users and locations are experiencing connection issues, enabling faster troubleshooting and proactive support for affected branches.
Built-In Sync Script Enhancements
You can now map the names of folders or FQDN of machines to a specific folder path using the Real-Time DX Console. This enables you to easily customize folder mapping synchronization for EUC or AVD machines, allowing for flexible and precise mapping based on your environment's requirements.
Sync DNS mappings
For AVD environments, you can set a default target DNS for all AVD session hosts, regardless of their internal Azure DNS suffix. To set a default target, create a mapping and leave the source suffix blank, before the comma separating it from the target DNS. For example: " ,your.target.dns"
Improved Query Performance
Queries in VDI & DaaS now load data continuously, allowing data to be displayed incrementally even before the full data set is retrieved from the monitors. This significantly reduces wait times and improves user experience for large data sets.
We now support Windows Server 2025 on monitors and agents for the following VDI environments, without impacting data collection:
AVD: We target the latest AVD API endpoints (Desktop.Virtualization).
CVAD: We target oData Monitor endpoints v3 and v4.
Deprecation of Export Schedules and PowerShell cmdlets
We deprecated the Export Schedule from the Console Settings and Monitors Settings in the Real-Time DX Console. The deprecated Export Schedule screen still displays in Monitors Settings, but we will remove it in a future version. We also deprecated all of the following PowerShell cmdlets for export rules from the ControlUp.PowerShell.User module:
Add-CUScheduledExportRule
Set-CUScheduledExportRule
Remove-CUScheduledExportRule
To query the current state of your monitors and export the results, use the Export-CUQuery cmdlet.
Deploy Agents Automatically from Monitor
In both version 9.1 and 9.0.5 private build 480, we restored the option to deploy ControlUp Agents automatically from Monitors using the Real-Time DX Console. To enable the automatic deployment of Agents from Monitors, click Settings > Agent, and select the Deploy agents automatically (from monitor only) checkbox.
Note that the automatic deployment of Agents from Monitors can degrade Monitor performance.
Enhanced Citrix Connection Troubleshooting
You can now troubleshoot Citrix connection failures using data tables retrieved by PowerShell cmdlets. To automate troubleshooting, use the data retrieved to configure Citrix connection failure triggers.
New PowerShell Cmdlets
Use new PowerShell cmdlets to perform the following configurations.
Manage Cloud Connections Cmdlets
Manage cloud connections for Citrix Cloud, CVAD, and Horizon CPA.
Get-CUCitrixClouds
                        Add-CUCitrixCloud
                        Update-CUCitrixCloud
                        Remove-CUCitrixCloud
                        Add-CUCitrixConnection
                        Update-CUCitrixConnection
                        Remove-CUCitrixConnection
                        Add-CUHorizonPod
                        Update-CUHorizonPod
                        Remove-CUHorizonPod
Breakdown Cloud Connections Cmdlets
Break down cloud data connections to resource groups.
Get-CUCloudConnectionBreakdownRules
                        Update-CUCloudConnectionBreakdownRules
Manage Sites Cmdlets
Manage independent monitor sites.
Get-CUSites
                        Add-CUSite
                        Update-CUSite
                        Remove-CUSite
Environment Configuration Cmdlet
Update monitor templates.
Set-CUMonitorTemplateBug Fixes
Real-Time DX (build 807)
254697: Independent Site Credential Assignment: You can successfully assign new credentials to Independent Sites that no longer fail with a "connection already exists" error. This now allows seamless credential updates without requiring manual reconnection.
259929: Citrix Monitor Memory Management: Excessive memory consumption no longer crashes in Citrix Monitor when processing ODATA calls. This significantly improves stability for environments with heavy Citrix monitoring workloads.
261792: Citrix Cloud Connection Credentials: Citrix Cloud connections now properly retain and use saved credentials, and longer cause an error when credentials aren't be found after initial setup.
Monitor Service Startup Stability: The Monitor service now starts reliably even under high system load, and timing issues no longer cause the Monitor service to fail during startup.
Real-Time DX (build 751)
254051: The Data Collector is now able to use outbound communication for large datasets.
248571: Bandwidth and latency metrics now display properly.
248908: Triggers are no longer removed inadvertently.
251876: Status History of Monitor window now displays historical entries properly.
253477: Citrix EUC connections now work properly.
253221: Fixes to shared credentials when using monitor independent sites, including adding more diagnostic logs.
254929: ControlUp data for large Citrix Cloud environments no longer display inconsistencies.
Real-Time DX (build 711)
241990: The cuMonitor.exe process no longer consumes higher RAM than expected.
248745: In the Active Application Title Settings tab, the values in the This is the action column display correctly. In the Browser URL Settings tab, the values in the This part of the URL is logged column display correctly.
249764: The Console successfully opens and loads organization configuration information during web login.
251896: The ControlUp certificate is automatically replaced and consistently deployed to all necessary pipelines.
Real-Time DX (build 693)
249761: Citrix EUC environment connections no longer cause excessive memory consumption by the citrix.monitor.exe process.
249993: Citrix EUC environment connections successfully connect to HTTP ports.
Real-Time DX (build 685)
237512: The Sessions view displays the correct data for CVAD user sessions.
248443: Built-in sync scripts successfully remove machines from the organization tree.
249352: After upgrading the Console, Security Policy permissions remain assigned to the current user roles.
249725: The Console successfully opens without throwing the error: “Web login error occurred”.
249765: Monitor installation is successful with no configuration initial request timeout issues.
Real-Time DX (build 661)
246727: The Console doesn’t crash when you right-click an object in the grid.
245802: Monitors successfully connect to the backend after upgrading the Advanced Authentication certificate.
247186: The Console successfully connects to the backend with no TLS issues.
Real-Time DX (build 654)
237498: Processes on machines with a non-English OS are successfully filtered from collections.
238504: Monitored EUC connections display the "Waiting Snapshot" status for as long as expected.
239195: Data collectors successfully register outbound connections for extensions.
241960: If the Console is connected to a Horizon 2412 environment, performance counter metrics display correctly for Horizon clients.
Web Interface (build 654)
241714: In the Machines (VDA) topology, the Average Logon Duration widget displays the accurate value.
Real-Time DX (build 642)
209043: Triggers for Windows services on the Console Service Monitoring settings list activate successfully.
223605: Only one data collector machine collects data from Citrix Cloud extension connections.
224546: When disconnected from the cuAgent, the cuAgent protocol no longer overrides the HDX protocol in the Session view of the Console.
238504: Monitored EUC connections don't display the "Waiting Snapshot" status for longer than expected.
239996: If the Console is unable to successfully load the configuration, it won't cause any machines to be deleted from the configuration.
240574: The following error is no longer thrown for Citrix Cloud extension connections in the Console: "System.NullReferenceException: Object reference not set to an instance of an object."
241722: We removed the Go to ControlUp Insights option from the machine actions menu.
Web Interface (build 642)
217174: All user sessions display the accurate Logoff Time after the sessions are logged off.
Real-Time DX (build 625)
219739: The Add-CUPolicyRoles PowerShell cmdlet considers only group membership SIDs to verify the Organization Owner or Roles Manager, not the current user SID.
238282: If Independent Site Configuration is enabled for Monitors, and you’re connected via UPN with relevant permissions, you can successfully execute actions using the ControlUp.PowerShell.User module.
Real-Time DX (build 615)
222017: CVAD 2411 is now supported.
237658: If you edit a Community Script Action Rule in the Virtual Expert Settings, the rule is immediately updated under the Console Script Actions options.
238075: When you install a ControlUp Monitor with the Install-CUMonitor PowerShell cmdlet, it also installs the Real-Time Agent Manager with the ControlUp Agent.
Real-Time DX (build 610)
236528: In Branch Name Mapping Settings, you can save a space as a default value.
236606: In Branch Name Mapping Settings, you can’t add duplicate IP ranges via both the Add-CUBranchMapping PowerShell cmdlet and CSV imports in the Console.
237168: If you run the ControlUp Automation module on machines with an outdated Agent Manager, it won’t result in error “8” during installation or uninstallation.
237593: The data node won’t continue to run the _dynamicNodeScaler initialization query for cluster state monitoring after the main query is closed.
237753: In Monitors Settings, the Export Schedule shows as deprecated.
Real-Time DX (build 597)
233972: Changes that you make in Data Upload Settings > Upload schedule are successfully saved and don’t cause configuration errors.
Web Interface (build 594)
235136: All topology items load properly and display valid data.
222715: The topology Total Resource Groups widget displays the correct count of resource groups.
233769: The “partial data” popup and yellow rectangle appear to indicate when ControlUp Monitors display partial data.
Known Issues
Real-Time DX
204578: The Invoke-CUAction PowerShell cmdlet might not accept user input parameter values.
207748: ControlUp Agents with many sessions might consume up to 12% CPU.
222029: The cuMonitor.exe process continues to run after its monitor service is stopped.
222582: When adding a new connection in the Real-Time DX Console, the Credentials list flickers if its length exceeds the dialog box.
222833: ControlUp Agent and Real-Time Agent Manager can’t be installed if .NET Core version 8 is installed on the same system.
223077: Data processes uploaded to monitors might be bloated if the machines are running Real-Time DX agent version 9.0 or lower.
224129: The Console crashes if left open past the timeout with an error “NullReferenceException : Object reference not set to an instance of an object.”
224277: After running the Add-CUHorizonPod PowerShell cmdlet, the specified Connection Servers Failover List isn’t applied.
224546: When disconnected from the cuAgent, the cuAgent protocol overrides the HDX protocol in the Session view of the Console (fixed in 9.1 build 642).
224553: When adding a Hypervisor connection in the Console, a Hyper-V virtual machine can’t be added.
224627: After running the Update-CUHorizonPod PowerShell cmdlet, the specified Connection Servers Failover List isn’t applied.
224999: If in DEX Global Settings (app.controlup.com), the Session Timeout for the Real-Time DX Console is set to a certain time (default is 24 hours) and the Real-Time DX Console is left open for longer than the Session Timeout, the Console might freeze and not get logged out as it should.
233920: When Independent Site Configuration is enabled, adding a domain assigned from one site to another site throws an error “One or more validation errors occurred.”
233936: When Independent Site Configuration is enabled and a Console is open on each site, after closing the Consoles one site throws an error “NullReferenceException : Object reference not set to an instance of an object.”
237099: If you add a vSAN connection to an Azure VMware Solution environment, denied permissions cause vSAN metrics to display as error (ERR).
238529: If you focus on Horizon Connection Servers in the Machines view, the HZ Certificate Expiration Date and HZ Connection Server Certificate Valid columns display metric values that don’t match the Horizon Console Certificate Management pane.
241668: When you switch sites in the Console, extension connections (e.g. Horizon, CVAD or Azure) aren't disconnected automatically.
243857: If you configure a Send an e-mail alert follow-up action, the Resend every option doesn’t send any follow-up emails after the initial email.
244212: If you use the Install-CUAgent PowerShell cmdlet with a non-existent -Site parameter, the installation will fail and display an unrelated error message.
254671: If you switch from one independent site to a second independent site, the Console continues to connect to extensions that belong to both the first and second sites, instead of limiting connections only to the second site’s extensions.
255884: Remote Clients: If you open an AVD session on a Windows Server 2019 Datacenter OS from a client device, Remote Clients metrics don’t display in the Console, and the following error appears in the cuAgent log: “Failed to write the pipe DataFromAgentJson, code #, sessionId #, failures count # ex = Pipe is broken.”
256961: If you are logged on to the Console and manually map a network drive, the mapped network drive doesn’t display in either the Console or the Web Interface. Workaround: Log off the Console and then log back on with the same user account. The mapped network drive will display as expected in both the Console and the Web Interface.
Web Interface
155967: The topology widget User Sessions (AVD) doesn’t display the correct RDP Shortpath Connections values.
233731: After running an action on an agent machine, the Requesting User column doesn’t display data in the VDI and DaaS Audit Log.
233867: The topology widget Citrix Sites doesn’t display the correct count of sites listed in the grid.
233869: The topology widgets Citrix Sites and Delivery Groups don’t list the same actions available for Citrix Delivery Group in the Console.
233901: The topology widget Processes doesn’t list the same actions available for Processes in the Console.
233896: When viewing Machines in the topology details in the web UI, you may not see the option Send Wake On LAN signal in the right-click menu of a machine. This option does appear in the Real-Time DX console
9.0.5
Released: September 15, 2024
Current build: 423
New features
Web Login
Log into the Real-Time DX Console through a browser with your ControlUp account. You no longer need an Active Directory or a domain user. You can use SAML SSO or Azure/Google OAuth to access the Console, and you can use SSO groups to manage Console permissions. User management is also simplified because you now access the Real-Time Console and app.controlup.com with the same account.
Trigger Management with PowerShell cmdlets
You can now create, read, update and delete triggers, and trigger actions, schedules and templates with PowerShell cmdlets, without having to access Trigger Settings in the Real-Time DX Console. You can efficiently perform bulk actions on triggers with increased flexibility, especially if you frequently update your organization's triggers.
Browser Performance Monitoring
Improve visibility into the performance of Google Chrome and Microsoft Edge by collecting browser URL and browser tab title information on a per process basis. You can identify performance issues caused by specific web pages that might affect the overall performance of the user session or even other users sharing the same infrastructure.
Citrix EDT Monitoring
You can now monitor Citrix EDT (Enlightened Data Transport) user sessions to gain better insight into users that access their virtualized Citrix environments using this method. You can benefit from enhanced real-time visibility into session reliability and performance.
Add Non-Domain Machines to ControlUp
You can now add non-domain joined machines to your organization with the Real-Time DX Console. You no longer need to use the Add-CUComputer PowerShell cmdlet to add a non-domain joined machine to the organization tree.
Bug fixes
189787: In the Real-Time DX Console org tree, a checkbox now appears as expected near Citrix Virtual Apps and Desktops + Citrix Cloud connections if “Enable Synchronization” is checked.
191830: For FSLogix, profile disks are now visible after upgrade.
192414: Using PowerShell scripts for monitor actions can now be enforced by the permissions set in the Security Policy.
200635: If you use the Uninstall PowerShell command to uninstall a monitor, the service is now completely uninstalled as expected.
201740: If outbound agent communication is disabled globally, gRPC server for outbound agent connections is no longer activated.
200164: The Monitor Management role is now assigned to only one monitor in a cluster.
209498: In the Security Settings window, all roles are now listed as expected after you create a new organization with a new user email account.
Known issues
If in DEX Global Settings (app.controlup.com), the Session Timeout for the Real-Time DX Console is set to a certain time (default is 24 hours) and the Real-Time DX Console is left open for longer than the session timeout, the Console may freeze and not get logged out as it should.
After the initial upgrade, if you open the Real-Time DX Console as the user with the Owner role, you may not see monitor status or hypervisor connections. The Controller, Incidents and Events panes may also be unavailable.
Workaround: Restart the Real-Time DX Console.CVAD 2411 is not currently supported. We are actively working on a solution, and a new 9.0.5 build will be released to include support for CVAD 2411.
9.0
Released: June 16th, 2024
Current build: 1680
New Prerequisites
ControlUp Agents
Any ControlUp Agent running 9.0 now requires .NET Framework 4.8. It is important that you install .NET Framework 4.8 before upgrading the agent to 9.0.
Network Requirements
For 9.0, you need to whitelist new URLs on your console and monitor machines to access our new backend services. You can find a full list of required DNS and ports here (for US and rest of the world) and here (EU)
Note that there are additional URLs to whitelist on your agents, if you want to use the the agent outbound communication feature.
Agent Outbound Communication
Reverse agent communication where agents initiate the communication ("outbound") with the ControlUp Monitors. By default, monitor machines will expose a gRPC server for agent outbound connections (over TCP 443). However, to mark an agent as ready for outbound communication, you need to explicitly set agents to be able to communicate outbound.
Benefits
Modernize agent to monitor communication over HTTPS.
Remove AD dependency for ControlUp Agent. You can now add non-domain-joined machines to the ControlUp organization.
Agent forward compatibility. When agents use outbound communication, agents can run higher version than the monitors.
Note
Inbound port 40705 is still required for:
Data Collector machines (API data collection for extensions)
Machines you want to manage via the Real-Time Console. For the Console to Agent communication, the agent still needs to listen to TCP port 40705.
To learn more about this feature, click here.
Monitor Metrics and Actions
This feature enhances visibility into the performance of your monitor clusters. These metrics are available in the VDI & DaaS view.
Note
Some of the new actions allow you to:
Create new triggers based on new monitor metrics.
Run the following actions on monitors:
Start monitor
Stop monitor
Restart monitor
Set monitor capacity
Set public DNS name
To learn more about this feature, click here.
Removed AD Dependency for Monitors
If you install your monitors on a workgroup machine, UPNs are no longer used. To configure the security policy of your ControlUp accounts, you can now configure security policy roles using DEX email addresses.
To learn more about this feature, click here.
Install Monitors with New Automation Module
In 9.0, you no longer need to use the Real-Time Console to install, upgrade or remove a ControlUp Monitor. Simply import the new ControlUp Automation module from the PowerShell gallery. Once you import the module into a PowerShell session, you can use the built-in PowerShell cmdlets to manage monitors programmatically. This new approach allows you to deploy the monitor on any workgroup PC (non domain-joined).
To learn more about this feature, click here.
Built-In Folder Synchronization
Synchronizing your AVD, CVAD, Horizon, and Citrix Cloud is now built-into RTDX. This allows you to add your virtual machines to the ControlUp organization tree without the need of manually adding them one by one. You can synchronize your machines manually from the console or by configuring the synchronization to be run automatically from your monitors. Synchronization options such as DNS mapping or Sites mappings are included, as well as the option to define specific host pools (AVD), desktop pools (Horizon) or delivery groups (Citrix).
To learn more about this feature, click here.
New PowerShell Cmdlets
Monitor Cmdlets
Install-CUMonitor
                            Invoke-CUMonitorUpdate
                            Uninstall-CUMonitor
Security Policy Cmdlets
Add-CUPolicyRoles
                            Get-CUPolicyRoles
                            Get-CUPermissionEntries
                            New-CUPolicyRoleDescription
                            New-CUPolicyRoleMember
                            New-CUPolicyRoleAcl
API Profile Management
Get-CUAPIProfile
                        Set-CUAPIProfile
                        Set-CUAPIToken
Horizon Management
Add-AddHorizonEUCConnection
                        Get-EUCConnections
                        Remove-EUCConnection
                        Update-HorizonEUCConnection
To learn more, click here.
Remote Control
You can now use Remote Control for VDI & DaaS which is available as an action in Solve and DEX. To learn more, click here.
Additional Features and Enhancements
Installation
When you deploy a Monitor, the ControlUp Agent is now automatically installed on the machine. Note any further upgrade of the monitor will not upgrade the agent. This needs to be done manually.
If you upgrade the ControlUp Agent to 9.0 from the console, a Real-Time Agent Manager is also installed on the agent machine. If you don’t want to install the Agent manager, go to Settings > Agent in the Real-Time Console and clear the checkbox Enable Agent Manager. Find more information about the agent manager here.
You can now use the Real-Time Console to manage ControlUp Agents installed on any machine with the MSI package. To learn more, click here.
FSLogix
You can monitor specific details about the FSLogix log file with the new columns Office Log File Size and Profile Log File Size in the web application. To learn more, click here.
You can now use FSLogix columns in Solve dashboards at any folder level.
We now support custom naming for FSLogix monitoring.
Azure
New Azure Budget metrics
Updated REST API versions for Azure.
New data collection interval configurations for Azure. To learn more, click here.
Citrix
You can now configure Advanced and Scheduled Triggers with a new STA record type to add values from the NetScaler STAs view columns in the Real-Time Console. To learn more, click here.
New CVAD Minimum Functional Level column in the Folders view. To learn more, click here.
New Citrix License metrics. To learn more, click here.
Additional supporting text in CVAD triggers for the following columns:
CVAD Database Avg. Transaction Time
CVAD Licensing Server State
CVAD Last Licensing Server Event
Bug Fixes
Real-Time DX (current build 1680)
192842: Agent connection fails with the following .NET error: “the formatter threw an exception while trying to deserialize the message due to an invalid DateTime string”.
194730: If the agent is installed via MSI without a Registration Key, the value “0” is written to the agent’s registry key, causing the agent to mistakenly attempt an outbound connection.
195996: Some monitors open a channel to the monitor proxy even if they are not View monitors.
196109: Inconsistent topology numbers for AVD machines.
196451: Missing signatures in appmond32.dll and appmond64.dll.
196598: In some cases, machines receive an empty SiteID, causing them to fail to connect outbound.
197130: Fixes for instabilities in agent outbound connections.
Real-Time DX (build 1616)
172028: If a performance counter is unavailable when you start an agent, the agent tries to connect to the counter only once, until you restart the agent.
182872: The Console fails to connect to an existing Azure connection with an error “The gateway did not receive a response from 'Microsoft.ResourceHealth' within the specified time period.”
185321: After you select the Enable built-in synchronization option and move a machine to a different folder, an additional checkbox appears next to the moved machine.
185602: Scheduled triggers stop firing with an error “This trigger was already scheduled for next invocation."
185862: cuAgentHelper.exe crashes after upgrading to version 8.8.
187084: The following indicators for Citrix Delivery Groups are not always populated as they should be: Enabled and Maintenance Mode.
187898: The Console causes high CPU utilization.
188055: The Monitor fails to get pending updates from the Real-Time DX configuration services.
188488: Azure Cloud Machine Actions are still available after you set them to “Deny” for a user in the Console Security Policy.
188908: Sometimes running the Install-CUMonitor PowerShell cmdlet fails to install the Monitor.
189037: In version 9.0 script-based actions are not available for unmanaged Azure machines. They run on the console and should be visible for machines even if those machines are unmanaged.
189303: When upgrading to version 9.0 the organizational scope set for a trigger changes automatically.
190049: A machine with an agent is connected to one organization and then moved to another organization, and its connection method is changed from inbound to outbound. When the agent is using inbound communication it is correctly connected to the second organization, but when changed to outbound communication, it shows as being connected to the first organization before it was moved.
190066: When installing an agent via MSI with an AuthKey but leaving the RegistrationKey empty, the agent attempts to connect via outbound connection.
190125: You can’t remove an SMTP server from Monitors Settings in the Console.
190203: The option to Set Outbound Communication on an agent should have its own Security Policy permission.
190609: Triggers with a nested folder scope are reset to “ScopeInclusions = badf00d0-bad0-bad0-bad0-badf00dbad00” after you upgrade the Console to version 9.0 and restart the monitors.
190639: After you move an EUC connection to a new subfolder, the Console throws the error “Moving the selected nodes failed. Nullable object must have a value.”
190665: The ControlUp.Common.Enums.dll file properties show an incorrect product version.
190707: The Install-CU Monitor command in PowerShell is missing a description and parameter descriptions.
194214: The Monitor stops listening to port 443 after you set it with an unresolved Public DNS Name.
Real-Time DX (build 1470)
134002: Warning popup appears after editing/removing a service name in the Service Monitoring window.
139714: AVD % Machines with successful AVD Agent upgrade” textbox is not fully visible in the trigger editor.
140464: Dump to Disk follow-up action doesn’t work.
141723: Cannot edit “Run an action” follow-up action due to grayed out “Template” field.
144305: Export Azure Machine view to an XLS (Excel 97-2003) throws an “Argument Out Of Range” error.
144750: Incorrect number of CPU cores and missing logical processors reported for XenServer hosts.
146664: Get-CUCredentials shows information about Site association when Site is already deleted.
149144: Real-Time DX doesn’t display the branch name for AVD user sessions in the Sessions grid.
Web Interface (current build 1567)
191090: Users unable to log into VDI & DaaS web UI because they don’t match Active Directory users on the Monitor machine.
Web Interface (build 8.7.0.737)
118241: Machines don’t appear in the Machines (Horizon) topology view.
142993: Wrong Stress Level for “AVD Host Pool Public Network Access” metric.
143868: Solve: Wrong number of available machines shown.
Known Issues
141867: When adding a WebHook (Send RESTful API request) in an Advanced or Scheduled trigger, the Stress Level is shown as Advanced.
162625: If you attempt to stop the agent, it may fail with the following error - Invalid Service Control.
179809: After upgrading, the Monitor Historical Upload Settings that were disabled may change to enabled while upgrading the
179872: Monitor Errors - Master service is unavailable from time to time
180784: A monitor with the broker role may display with the wrong hostName.
182777: Remote Control - Screen dropdown list button is missing (when user have more than 2 screens)
187786: Monitor Metrics: In some cases, duplicated monitor records are displayed. Workaround: Restart your monitor cluster
188071: Monitor Association was broken on Azure Agent and Monitor - Duplicate records
189308: Monitor Metrics: In some cases, the cuAgent is missing the Agent tagging and this causes to broken topology drilldown
189787: Console: Org Tree: checkbox does not appear near Citrix Virtual Apps and Desktops + Citrix Cloud connections if "Enable Synchronization" is checked
190333: Monitor - Monitor fails to stop - remains in status 'Stopping'. Workaround: Restart the monitor manually
8.8 Maintenance Release
Released: November 26, 2023
Current build: 1067
Important Notes
The Process Data Collection feature introduced in this version is enabled by default. Once you upgrade to 8.8 MR, system-level processes will automatically be filtered in the Real-Time DX Console and Solve.
Read this knowledge base article to learn how to add these processes to the Process Inclusion List.
New Features and Enhancements
Real-Time DX
Azure Government: Adding an Azure Government Cloud to ControlUp is now supported.
Custom Tags Column: You can now add a custom Tags column to the Machines and Sessions views by using registry settings to create new keys. Use the Tags column to show the values that you configure. Learn more here.
CVAD Data Collection Columns: You can now add CVAD Data Collection columns to show CVAD data collection metrics in the Folders, Machines, Sessions, and Applications views. Learn more here.
Process Data Collection: You can use the Process Data Collection feature to specify which system and non-user attached processes should not be collected by the ControlUp Agents. Reducing agent resource usage leads to better overall data collection and performance. Learn more here.
Network Drives Column Preset: You can add the Detailed Network Drive Info column preset to the grid in the Storage view. The preset enables you to more efficiently monitor your mapped Windows network drives. Learn more here.
Secure Boot: Application Load Time feature with Secure Boot turned on is now supported.
Solve
Network Drives in Solve: You can now view the network drives of managed machines if you drill down to specific sessions in the Topology view. Learn more here.
Bug Fixes
Real-Time DX (992 build)
120436: Configuration service endpoint isn’t detected.
136564: Logon Duration doesn’t display the correct color in the grid for custom stress level settings.
140464: Dump to Disk follow-up action doesn’t work.
141723: Cannot edit Run an action follow-up action due to grayed out Template field.
144270: The Invoke-CUQuery PowerShell cmdlet fails to run on ControlUp Monitors.
144305: Export Azure Machine view to an XLS (Excel 97-2003) throws an “Argument Out Of Range” error.
145315: You can’t perform Install Agent or Deploy ControlUp Agent actions on machines after you upgrade the console version.
146254: The coordinator stops reporting data after you create and execute a scheduled folder trigger.
148662:Script-based actions don't appear in the Real-Time Console if the “Category” and “ActionCategory” fields have values in the action metadata.
149144: Real-Time DX doesn’t display the branch name for AVD user sessions in the Sessions grid.
149490: MSP environment:The monitor of a tenant fails to connect after you update the tenant with an expired user password.
149921: Large process files corrupt the log files of the monitor.
149961: Azure machines don’t appear in the grid in the Real-Time Console or in Solve if you add them to a new resource group for existing connections.
151052: No hypervisor data shown in the Real-Time Console DX and Solve.
151142: AVD Session Connection Type and AVD Session Connection Transport columns in the Sessions view display N/A for AVD sessions.
151272: Monitors don’t show association with Horizon RDS machines if you add them as EUC and hypervisor.
152381: The option Disable views that depend on process-level information is missing from Advanced Settings.
154118: The ControlUp Agent fails to connect to the cuAgentHelper via the pipe.
155594: If you enable MSP mode, editing shared credentials fails if you don’t set the domain to primary.
155643: The Real-Time Console can’t add an Azure connection with local credentials.
155911: Monitor crashes due to an exception in association mask distribution.
Real-Time DX (1012 build)
163560: Running Solve Script Actions will only work if Org Members role has the "Run Shared Script Action" permission
162491: The process “AppLoadTimeTracer” is now included in the global inclusion list.
163605: Session Logon Duration data isn't saved if the CUAgent restarts.
163671: Monitor doesn’t upload all CacheActivity files when it returns from offline mode to online mode.
Real-Time DX (1021 build)
171129: cuAgentHelper.exe may crash after upgrading to version 8.8 MR.
The following features may not work as expected: Remote DX, Active Application and monitor network drive metrics.
Solve
135153: Top Consumer Users names don’t appear in reports after you logoff and login to a session.
150665: Enable\Disable maintenance mode actions fail on unmanaged Citrix machines.
154456: Machines don't appear in the Host Pools or AVD Workspaces topology views.
155906: The Sessions Stress Level widget displays data from system sessions.
157573: The number of processes in the Monitored Processes column in the grid doesn’t match the number of processes in the topology.
161462: Incorrect data appears for an agentless machine if you drill down to a Horizon session in the Machines (Horizon) topology view.
162049: The ControlUp Monitor returns the “HighStressedSessions” value even if there are no sessions.
Remote DX
138305: Remote DX – IGEL: Switching between WIFI to Ethernet – WIFI metrics are frozen.
139556: Remote DX data doesn’t display in the Sessions view if you select the Remote DX Column Preset.
141607: Can’t read ‘PING’ response from virtual channel “cuepux” for HZ Session.
143855: Redundant errors appear in the CUAgent log if the Remote DX plugin isn’t installed on the client machine.
145290: IGEL: The grid displays active data for a session 5 minutes after restarting the client machine.
149512: If you don’t install a Remote DX client plugin, the “vmware-rdpvcbridge-cuAgentHelper” log saves redundant files for the session.
Known Issues
Real-Time DX
139714: AVD % Machines with successful AVD Agent upgrade textbox isn’t fully visible in the trigger editor.
Solve
118241: Machines don't appear in the Machines (Horizon) topology view.
Remote DX
156761: If you install Remote DX on a macOS version 10.15 or earlier, Citrix Viewer crashes or displays a gray screen instead of the remote desktop.